Fig. 7.
Download original image
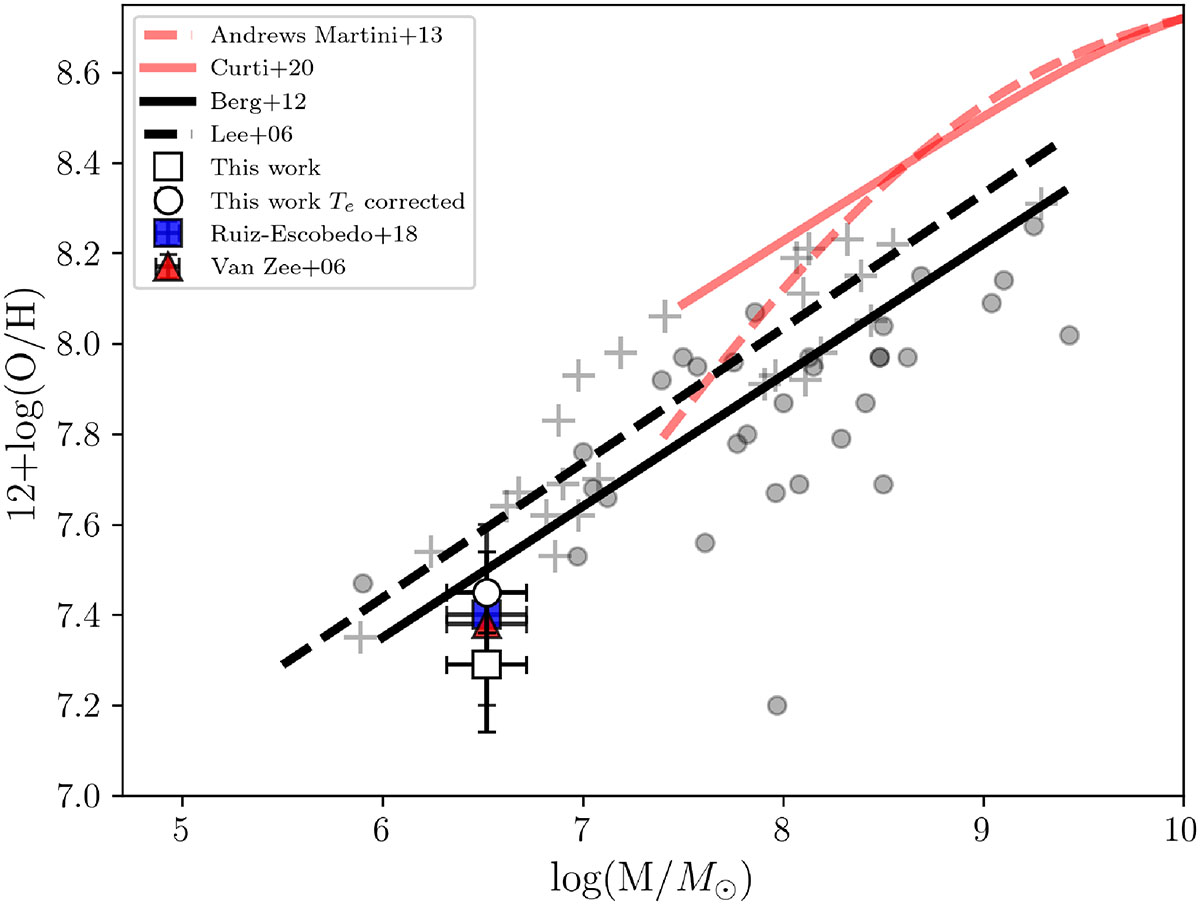
Leo A in the mass-metallicity plane, with white square and white dot representing uncorrected and corrected metallicities for Te fluctuations, respectively. The VZ06 (R23) and R18 (Te−based) measures were included as the red triangle and blue square, respectively, for comparison. Dashed and solid black lines are the Lee et al. (2006) and the Berg et al. (2012) low-mass end of the MZR, respectively. The grey crosses and the grey dots are their respective samples. The solid red curve and the dashed red curve are the MZR of the local Universe from Andrews & Martini (2013) and Curti et al. (2020), respectively.
Current usage metrics show cumulative count of Article Views (full-text article views including HTML views, PDF and ePub downloads, according to the available data) and Abstracts Views on Vision4Press platform.
Data correspond to usage on the plateform after 2015. The current usage metrics is available 48-96 hours after online publication and is updated daily on week days.
Initial download of the metrics may take a while.