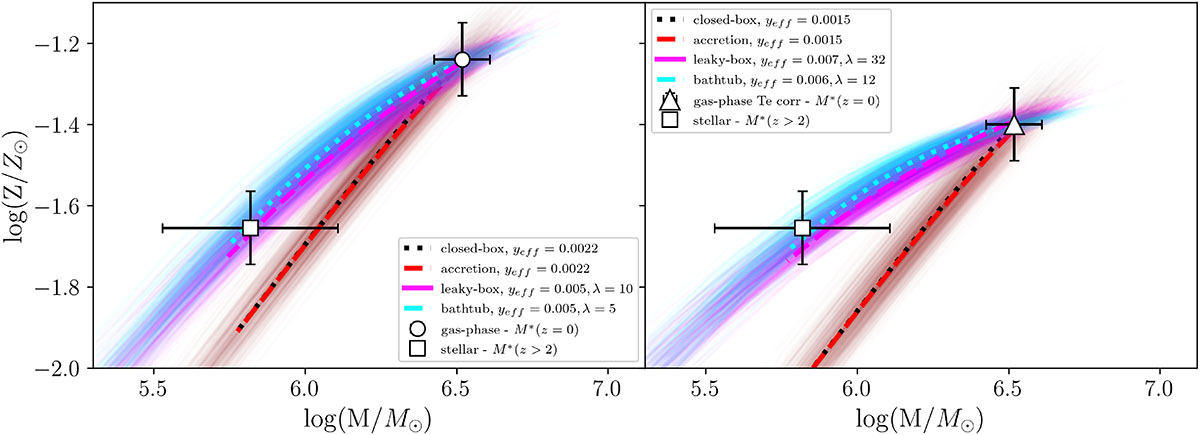
Fig. 8.
Download original image
Evolution of Leo A over the last 10 Gyr in the mass-metallicity plane. Left panel: White square represents Leo A 10 Gyr ago, whereas the white dot represents Leo A in the present day. The closed-box-model and accretion-model median tracks that approach our estimates are shown as the dotted black and dashed red lines, respectively. The leaky-box and the gas-regulator (bathtub) model median tracks that reproduce our estimates are shown with the solid magenta and the dashed cyan curves, respectively. The closed-box, accretion, leaky-box, and gas-regulator tracks generated by the Monte Carlo simulations are shown with the semi-transparent black, red, magenta, and cyan curves, respectively. Right panel: Same as left panel, but using the Te− corrected gas-phase metallicity as the present-day chemical status of Leo A, shown with the white triangle.
Current usage metrics show cumulative count of Article Views (full-text article views including HTML views, PDF and ePub downloads, according to the available data) and Abstracts Views on Vision4Press platform.
Data correspond to usage on the plateform after 2015. The current usage metrics is available 48-96 hours after online publication and is updated daily on week days.
Initial download of the metrics may take a while.