Open Access
Fig. A.1.
Download original image
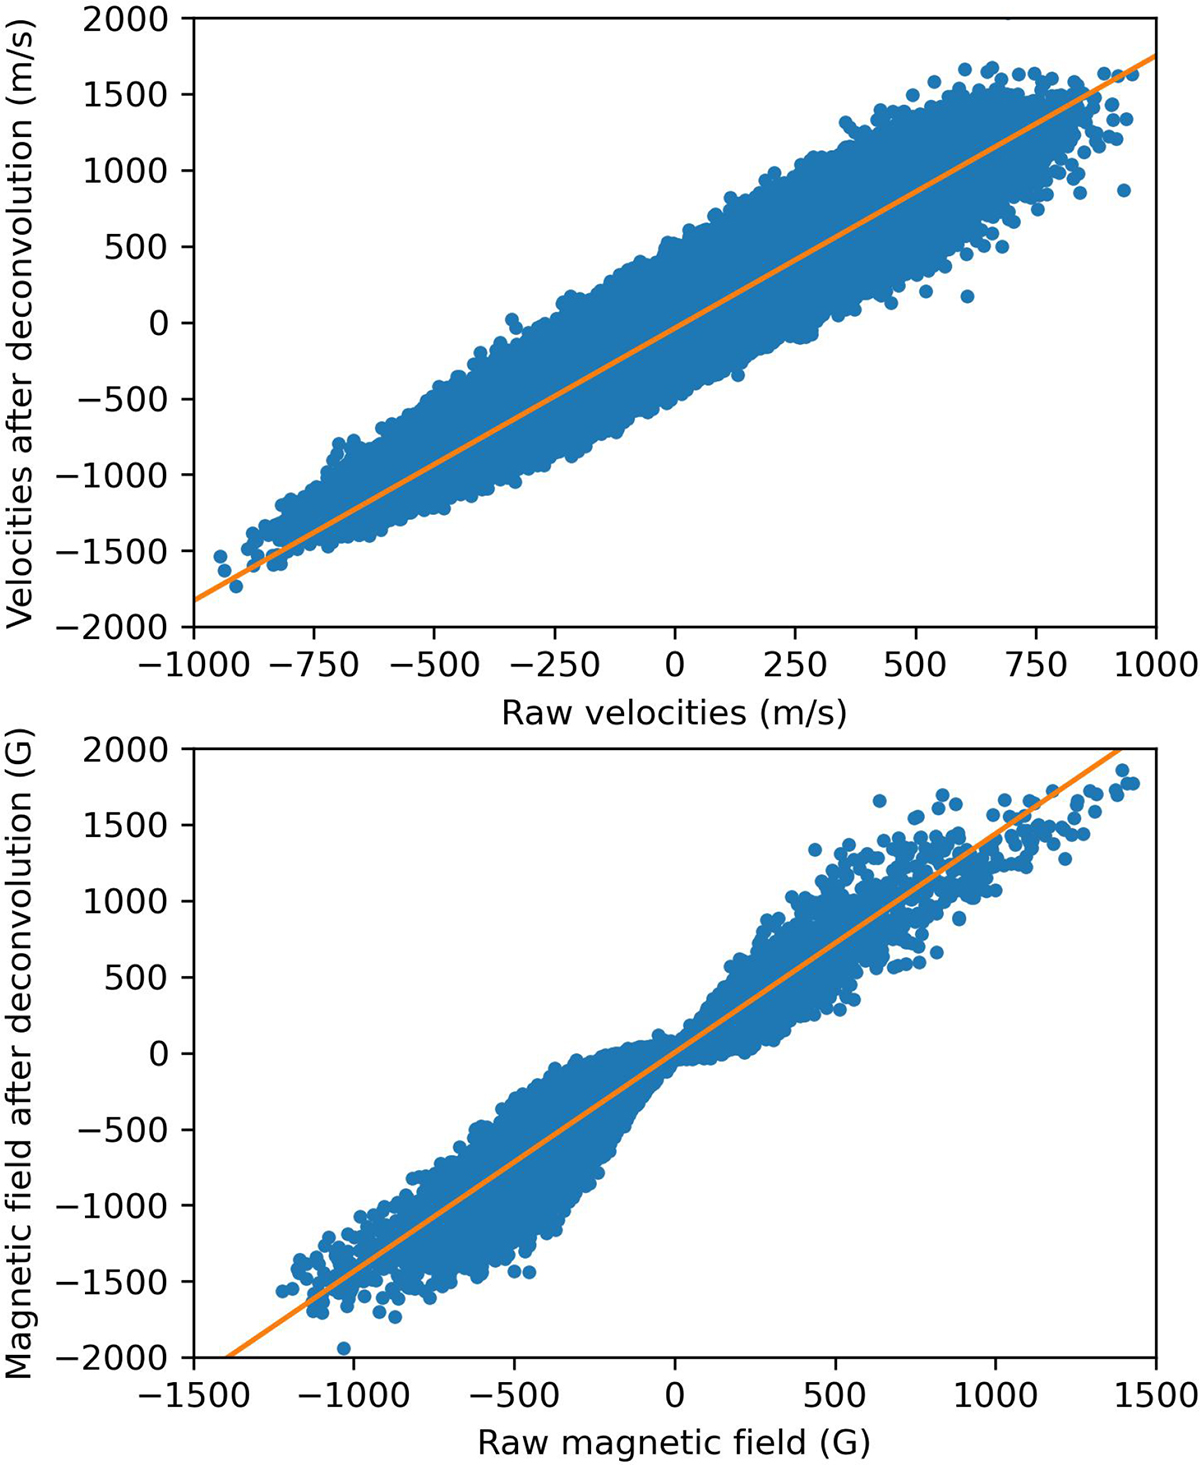
Comparison of the velocity fields (after the correction described in Sect. 3.2 including rotation, upper panel) and magnetic fields (lower panel) for part of an image at disc centre before and after deconvolution. Each point corresponds to one pixel.
Current usage metrics show cumulative count of Article Views (full-text article views including HTML views, PDF and ePub downloads, according to the available data) and Abstracts Views on Vision4Press platform.
Data correspond to usage on the plateform after 2015. The current usage metrics is available 48-96 hours after online publication and is updated daily on week days.
Initial download of the metrics may take a while.