Open Access
Fig. 2.
Download original image
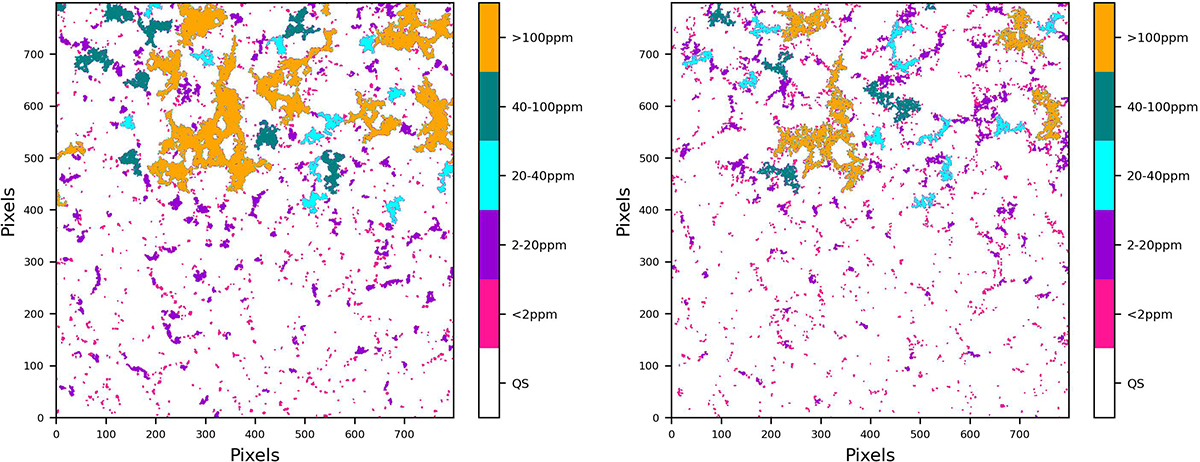
Zoomed-in image at disc centre on a segmented map, illustrating the magnetic structures in different size ranges, for Set 1 (left panel) and Set 2 (right panel). The two maps are separated by 2.5 hours, which distorts the structures only slightly.
Current usage metrics show cumulative count of Article Views (full-text article views including HTML views, PDF and ePub downloads, according to the available data) and Abstracts Views on Vision4Press platform.
Data correspond to usage on the plateform after 2015. The current usage metrics is available 48-96 hours after online publication and is updated daily on week days.
Initial download of the metrics may take a while.