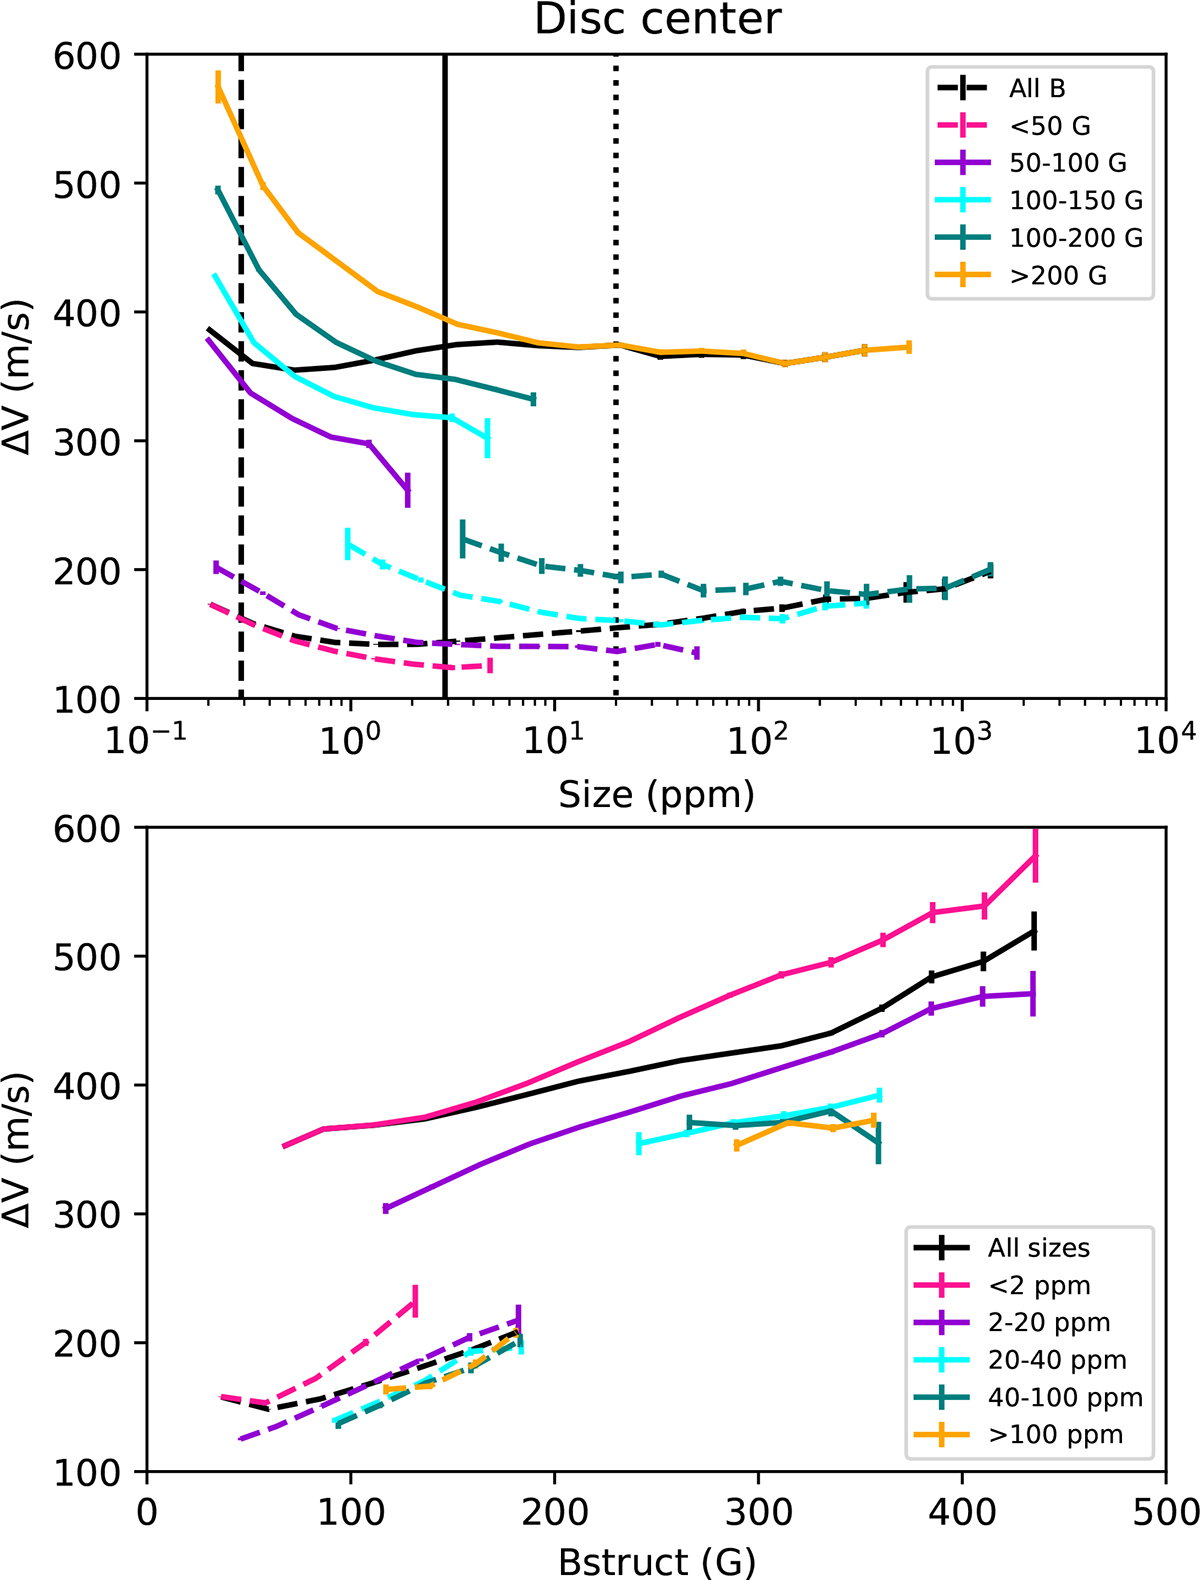
Fig. 4.
Download original image
ΔV as a function of average magnetic flux for the structure approach at disc centre (μ > 0.95) vs size for different ranges of B (upper panel) and vs B for different ranges of size (lower panel), for Set 1 (dashed) and Set 2 (solid). The black curves are for all B (all sizes). The vertical black lines correspond to the typical granular size (dashed), the box size (solid), and the 20 ppm scale (network-active region interface, dotted).
Current usage metrics show cumulative count of Article Views (full-text article views including HTML views, PDF and ePub downloads, according to the available data) and Abstracts Views on Vision4Press platform.
Data correspond to usage on the plateform after 2015. The current usage metrics is available 48-96 hours after online publication and is updated daily on week days.
Initial download of the metrics may take a while.