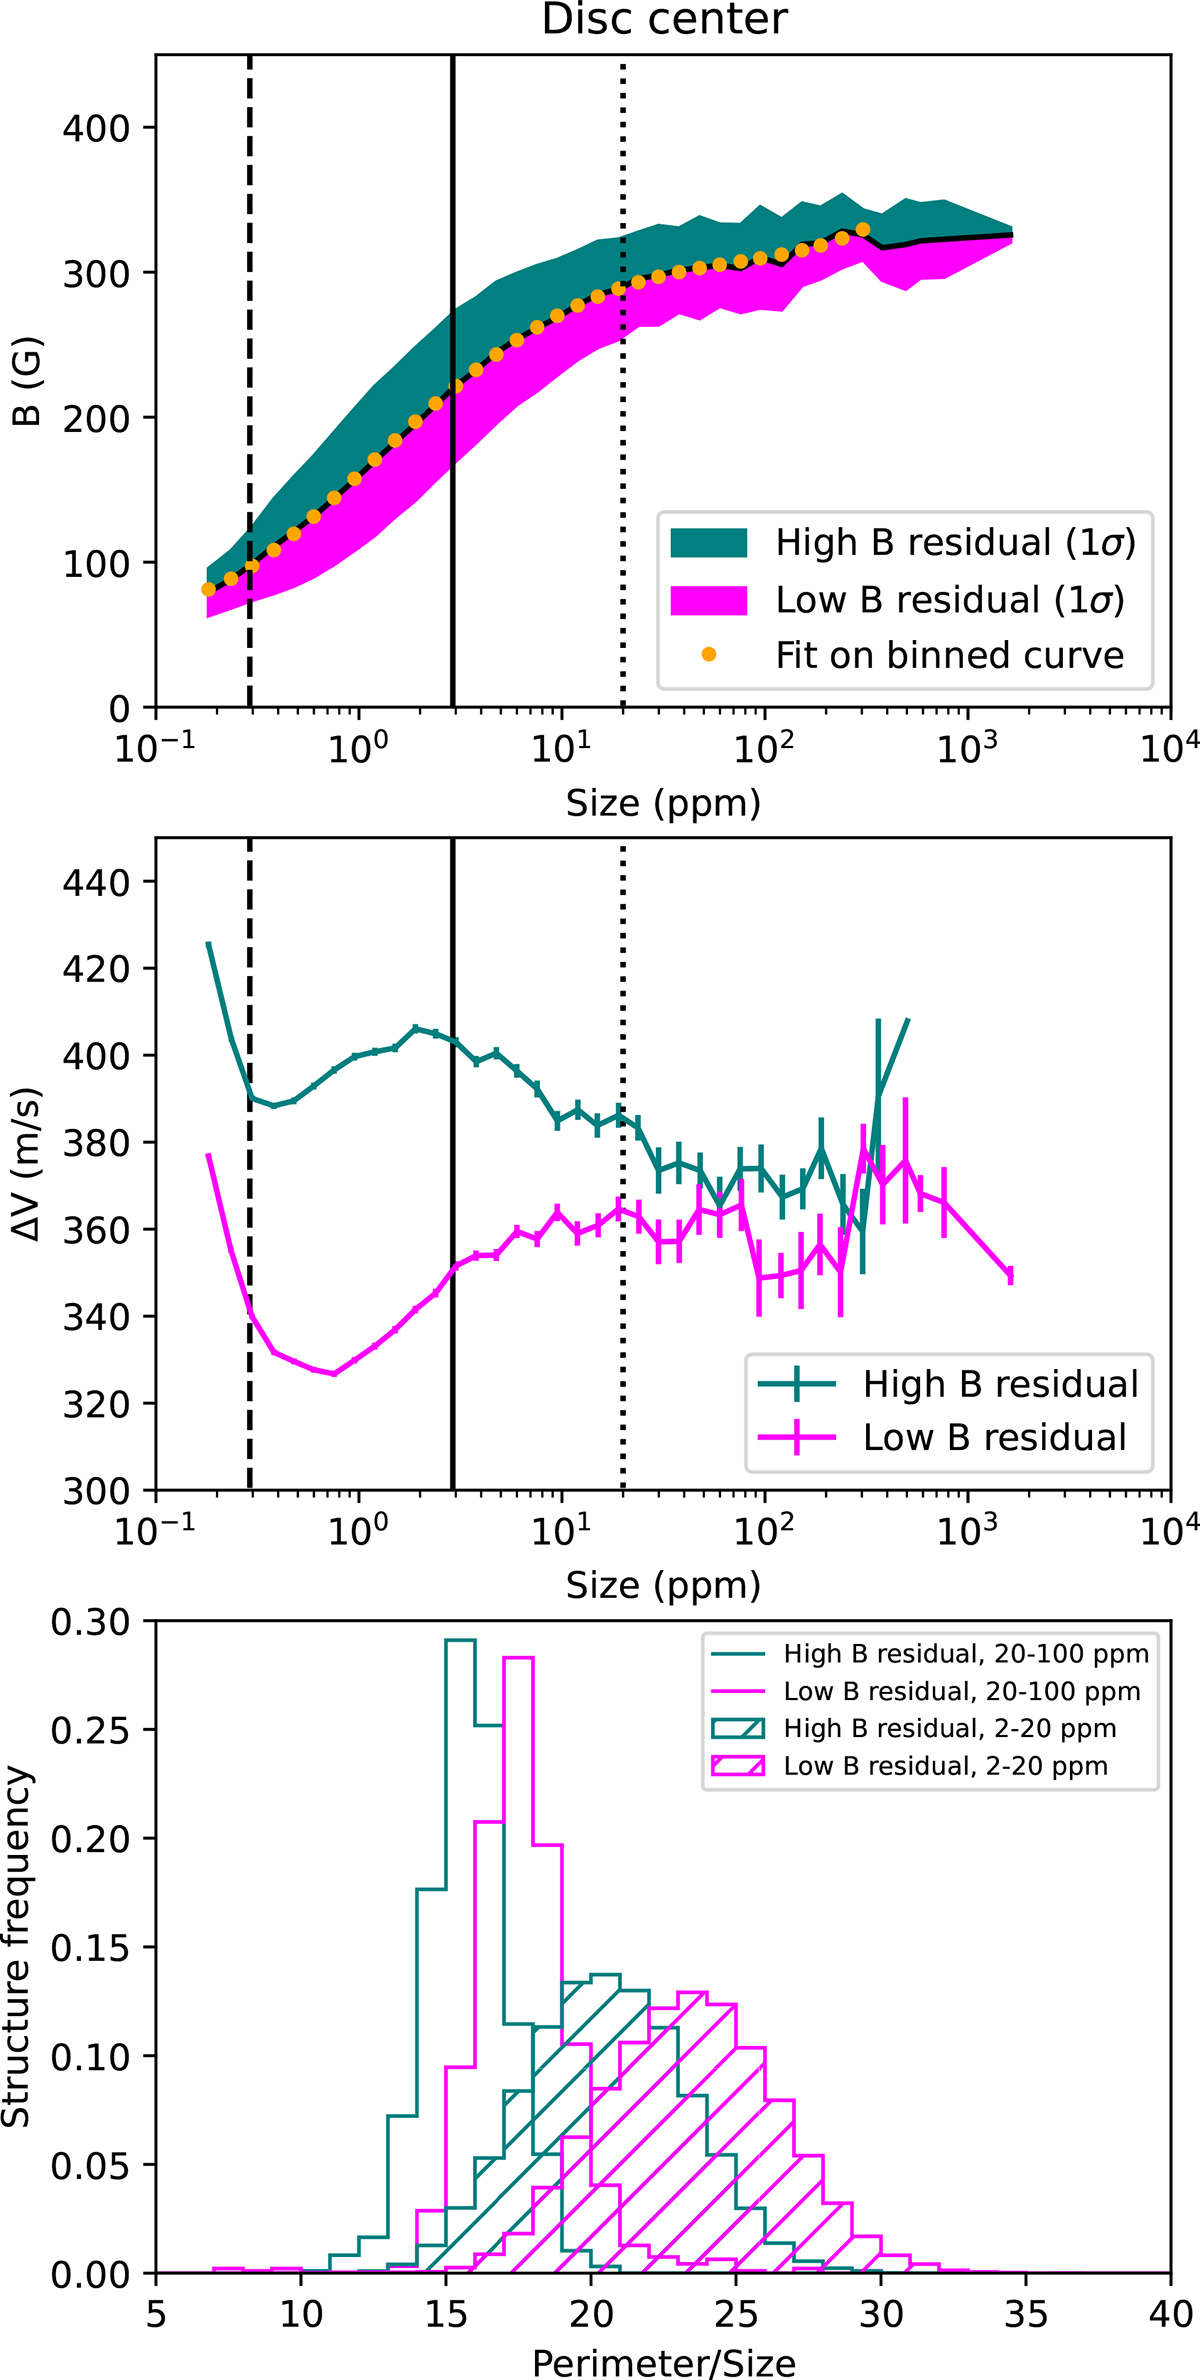
Fig. 5.
Download original image
Upper panel: B vs structure size for Set 2. The coloured area show the 1σ dispersion, and the orange dots a polynomial fit on the binned B vs size. Middle panel: ΔV vs size for the two categories of structures, with B larger than the orange curve in green, and with B smaller than the orange curve in magenta. Lower panel: Distribution of the perimeter/size ratio for these two categories of structures. The vertical black lines correspond to the typical granular size (dashed), the box size (solid), and the 20 ppm scale (network-active region interface, dotted).
Current usage metrics show cumulative count of Article Views (full-text article views including HTML views, PDF and ePub downloads, according to the available data) and Abstracts Views on Vision4Press platform.
Data correspond to usage on the plateform after 2015. The current usage metrics is available 48-96 hours after online publication and is updated daily on week days.
Initial download of the metrics may take a while.