Fig. 4
Download original image
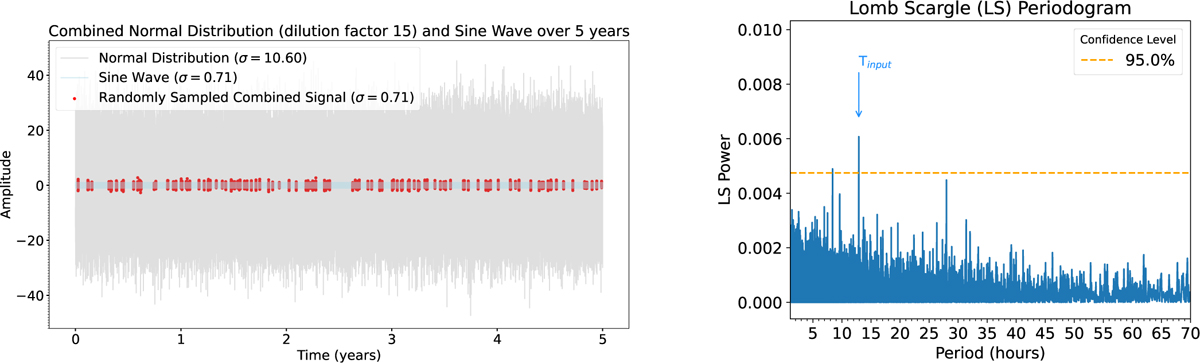
(Left panel) Semi-regularly spaced sinusoidal wave with period Tsine = 12.90 h (light blue), normal distribution with a standard deviation of σ = K × σsin with K = 15 (light grey), and combined signal with higher signal-to-noise ratio (red points). The samples are gathered into 125 intervals of eight hours spaced by N × 23.93 hours. (Right panel) Corresponding LS periodogram. The 95% confidence level is also shown in the LS periodogram.
Current usage metrics show cumulative count of Article Views (full-text article views including HTML views, PDF and ePub downloads, according to the available data) and Abstracts Views on Vision4Press platform.
Data correspond to usage on the plateform after 2015. The current usage metrics is available 48-96 hours after online publication and is updated daily on week days.
Initial download of the metrics may take a while.