Fig. 6
Download original image
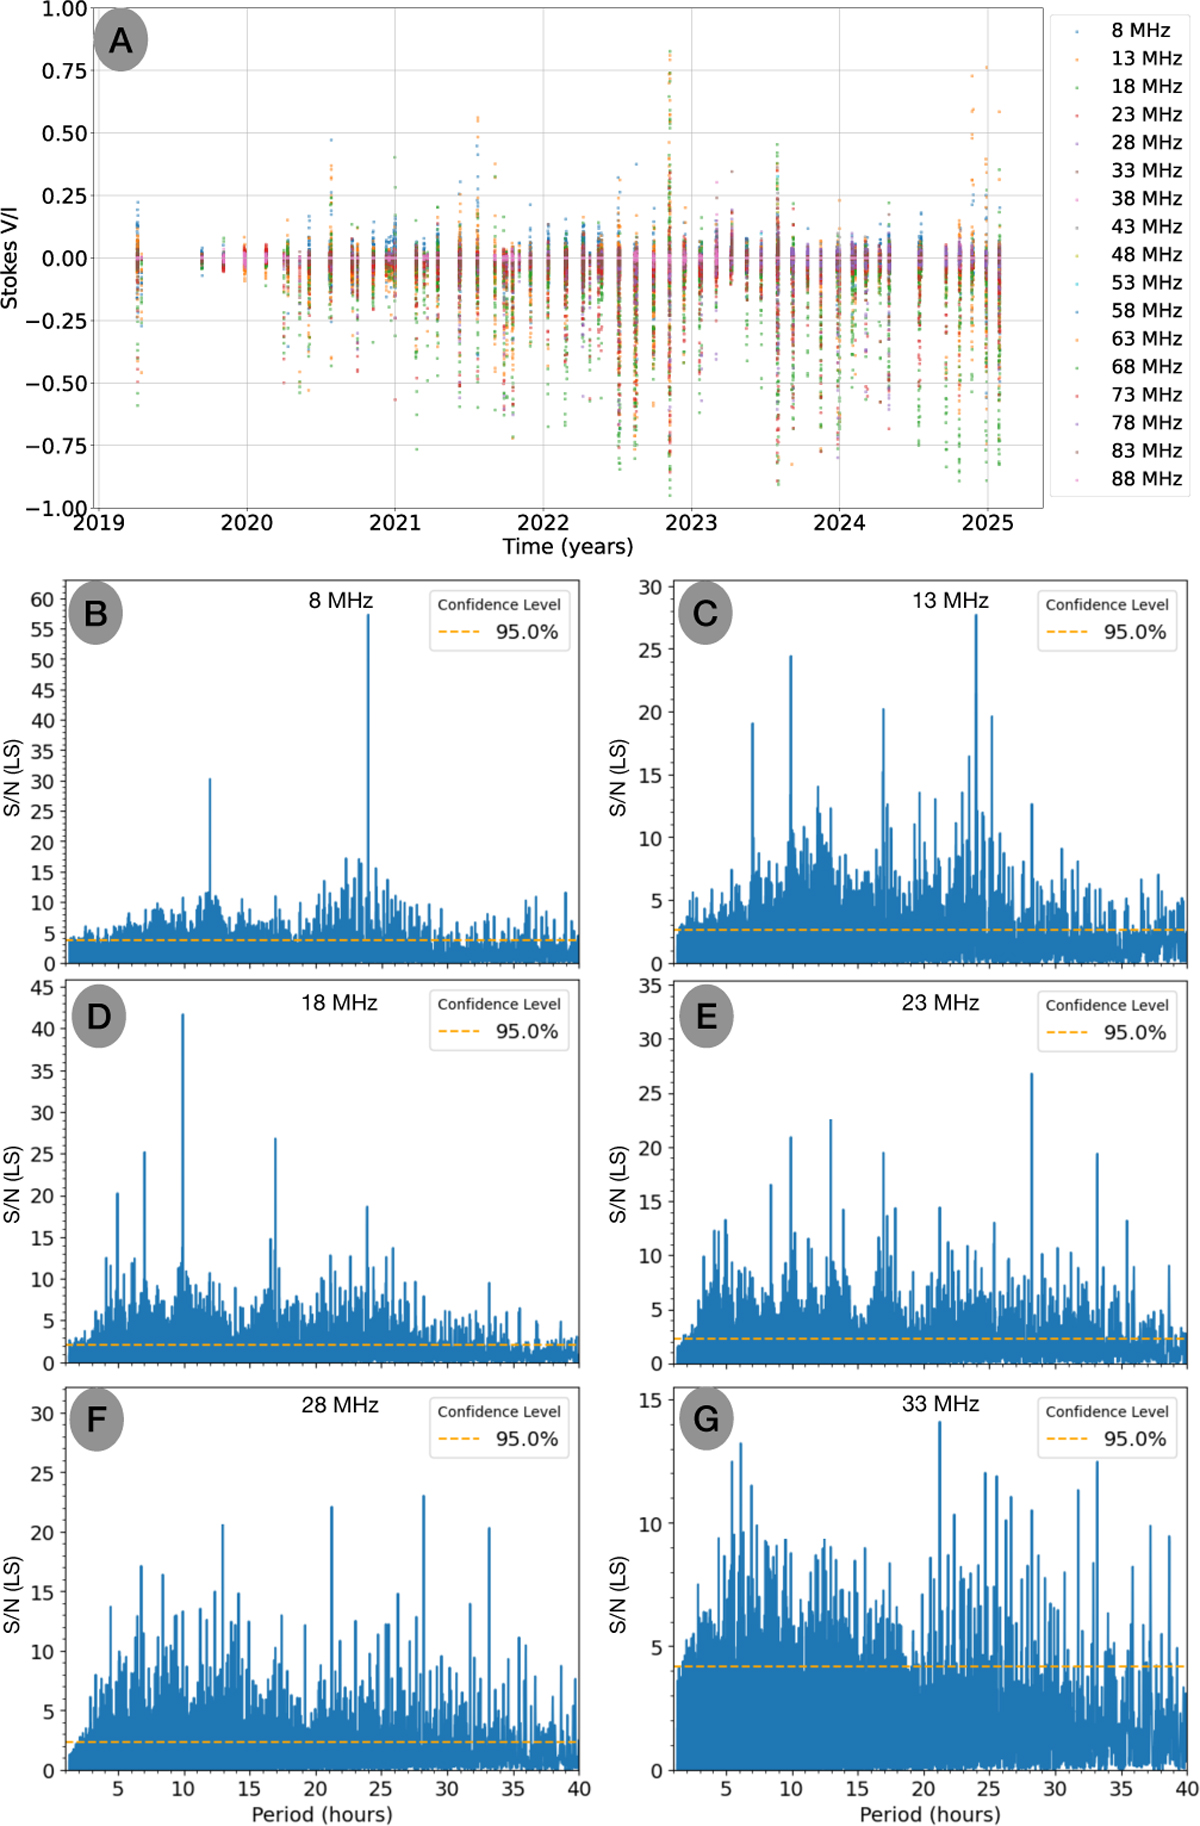
(A) Real data from NenuFAR observations. The colour corresponds to different frequency ranges of 5 MHz. (B-G) Corresponding periodograms of the S/N of the LS power (noted S/N(LS))for seven frequency ranges averaged on a 5 MHz bandwidth: (B) [8, 13[ MHz, (C) [13, 18[ MHz, (D) [18, 23[ MHz, (E) [23, 28[ MHz, (F) [28, 33[ MHz, (G) [33, 38[ MHz. The 95% confidence level is also shown in the LS periodograms.
Current usage metrics show cumulative count of Article Views (full-text article views including HTML views, PDF and ePub downloads, according to the available data) and Abstracts Views on Vision4Press platform.
Data correspond to usage on the plateform after 2015. The current usage metrics is available 48-96 hours after online publication and is updated daily on week days.
Initial download of the metrics may take a while.