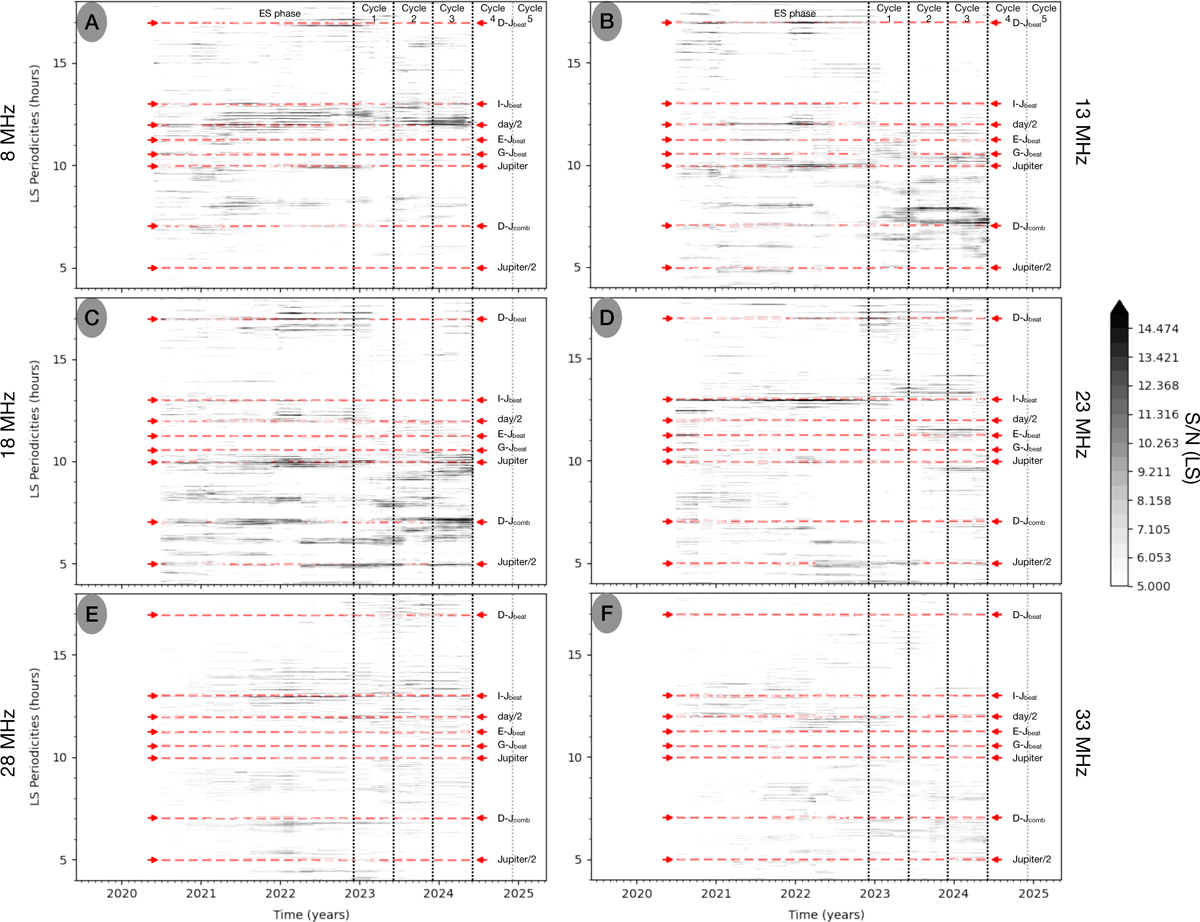
Fig. 8
Download original image
S/N of 2D LS periodograms for six different 5-MHz frequency intervals ([8, 13[ MHz, [13, 18[ MHz, [18, 23[ MHz, [23, 28[ MHz, [28, 33[ MHz, and [33, 38[ MHz). In each panel, the Y -axis represents the LS periodicities, and the X-axis represents the calendar time (in years). The LS periodograms are calculated over a 500 day sliding window, which shifts by two days. The mean time is taken for each window, and the corresponding S/N of the LS periodogram is displayed in grey. The colour bar, thresholded to remove background noise from the periodograms, is the same for all panels. The different dashed red lines give (from top to bottom) the following periodicities: Tbeat D-J, Tbeat I-J, Tday/2, Tbeat E-J (for Europa-Jupiter), Tbeat G-J (for Ganymede-Jupiter), TJupiter, Tcomb D-J, and TJupiter/2. The vertical dotted line indicates the NenuFAR observing phase, from Early Science to Cycle 5.
Current usage metrics show cumulative count of Article Views (full-text article views including HTML views, PDF and ePub downloads, according to the available data) and Abstracts Views on Vision4Press platform.
Data correspond to usage on the plateform after 2015. The current usage metrics is available 48-96 hours after online publication and is updated daily on week days.
Initial download of the metrics may take a while.