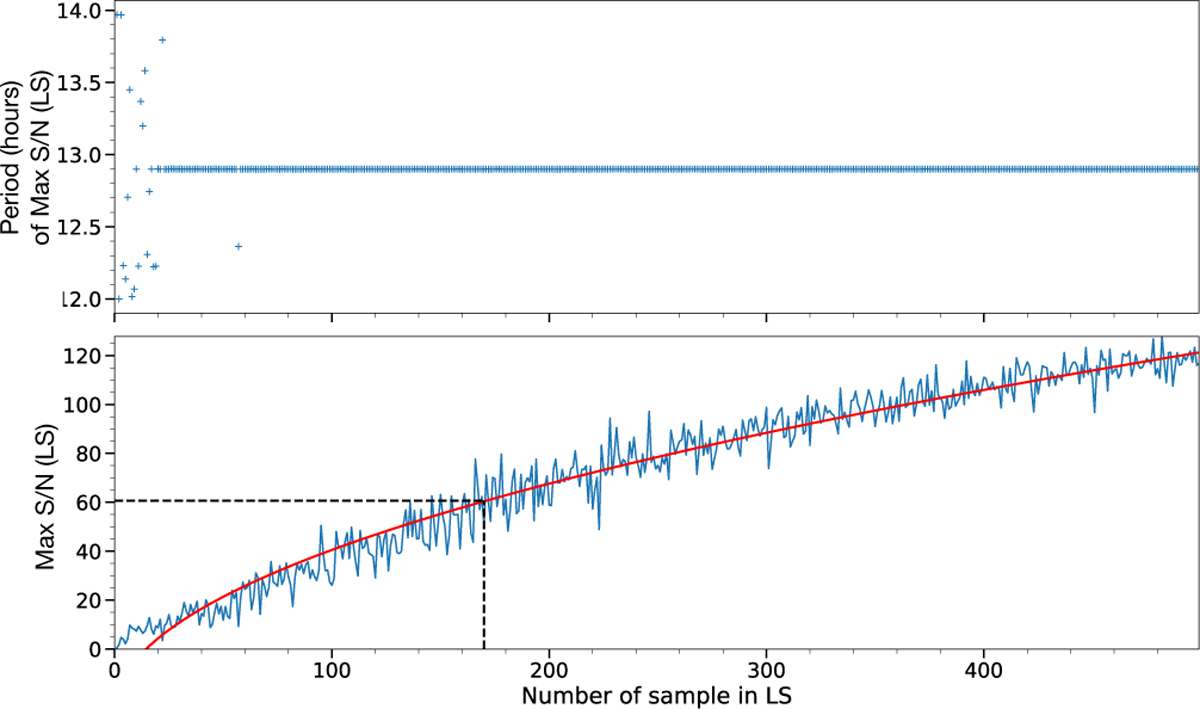
Fig. A.1
Download original image
Evolution as a function of the number of simulated observation samples inserted into the LS analysis of (top panel) the value of the maximum peak of the LS periodogram (in hours) and (bottom panel) of the S/N (of the LS periodogram) of the associated peak in the LS. The red curve is a simple fit y = a × √(x) + b, with x the number of samples, a = 5.188 and b = −14.545. Here the simulated signal is diluted into noise, with a standard deviation σnormal distribution = K × σsine with K = 8.. The black dashed lines highlight sample N = 170 corresponding to the number of observation samples in the real data (see Figure A.2).
Current usage metrics show cumulative count of Article Views (full-text article views including HTML views, PDF and ePub downloads, according to the available data) and Abstracts Views on Vision4Press platform.
Data correspond to usage on the plateform after 2015. The current usage metrics is available 48-96 hours after online publication and is updated daily on week days.
Initial download of the metrics may take a while.