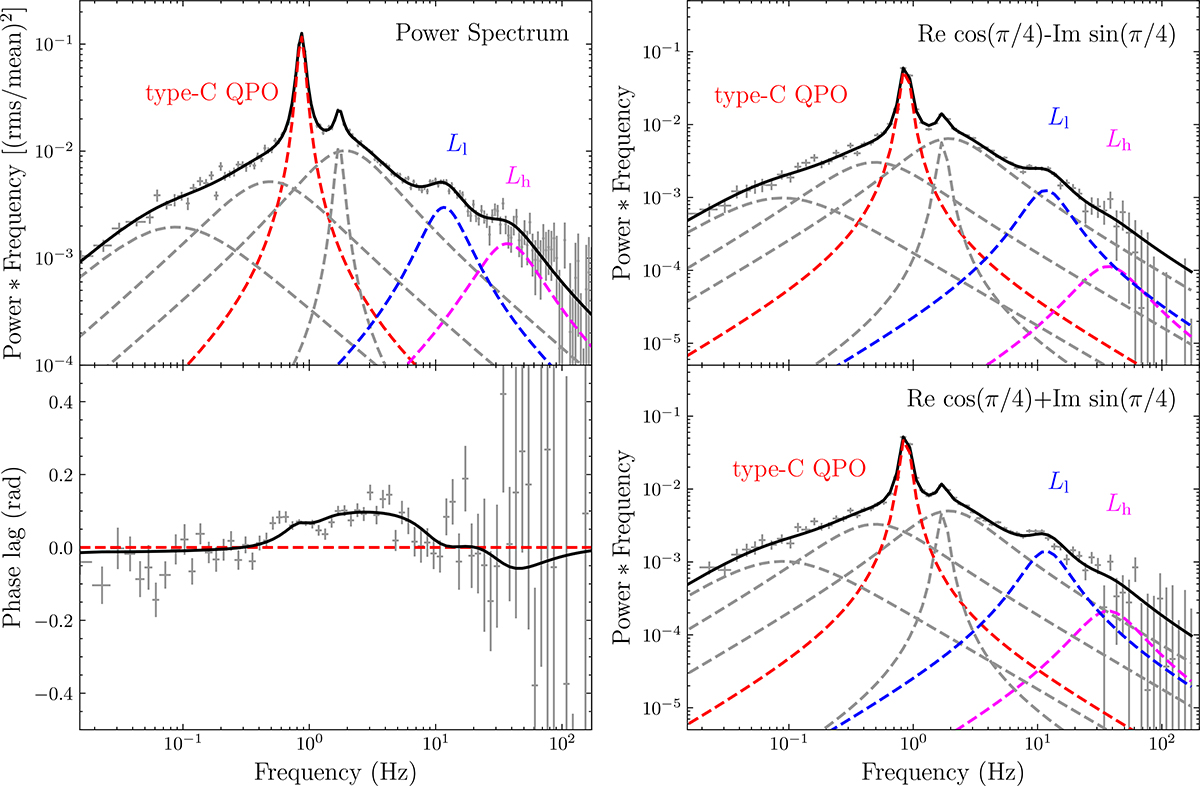
Fig. 3.
Download original image
Upper-left panel: PDS in the 4–10 keV energy band. Lower-left panel: Phase lag vs. Fourier frequency (phase-lag spectrum) together with the derived model obtained from the fits to the power and cross spectra. Upper-right and lower-right panels: Real and imaginary parts of the cross spectrum calculated for the 4–10 keV band with respect to the 2–4 keV band. For the fitting and the plot, we rotated the cross-vector by 45°. We modeled the PDS using seven Lorentzian functions. Additionally, we fit the real and imaginary parts of the cross spectrum by fixing the frequency and FWHM of each Lorentzian to the values derived from the best-fit model of the PDS. Type-C QPO corresponds to the Lorentzian function used to fit the type-C QPO, while Ll and Lh represent the Lorentzian functions fitting the two high-frequency humps.
Current usage metrics show cumulative count of Article Views (full-text article views including HTML views, PDF and ePub downloads, according to the available data) and Abstracts Views on Vision4Press platform.
Data correspond to usage on the plateform after 2015. The current usage metrics is available 48-96 hours after online publication and is updated daily on week days.
Initial download of the metrics may take a while.