Open Access
Fig. 4.
Download original image
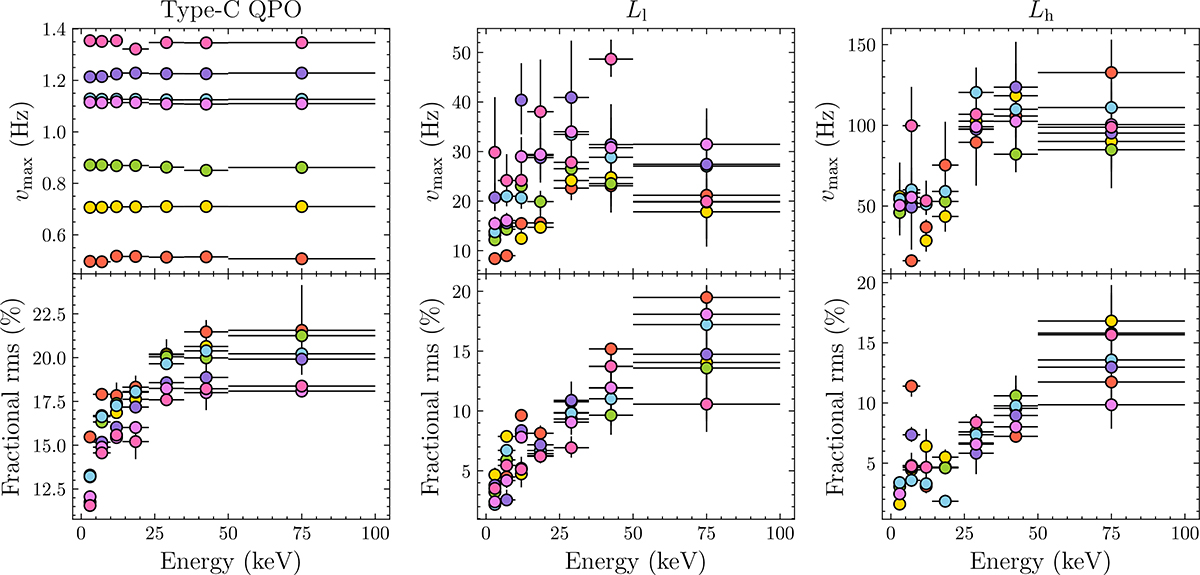
Energy dependence of the characteristic frequency and fractional rms of the type-C QPO and the two high-frequency humps (Ll and Lh) for each data group. The color scheme for the seven data groups follows that highlighted in Fig. 2.
Current usage metrics show cumulative count of Article Views (full-text article views including HTML views, PDF and ePub downloads, according to the available data) and Abstracts Views on Vision4Press platform.
Data correspond to usage on the plateform after 2015. The current usage metrics is available 48-96 hours after online publication and is updated daily on week days.
Initial download of the metrics may take a while.