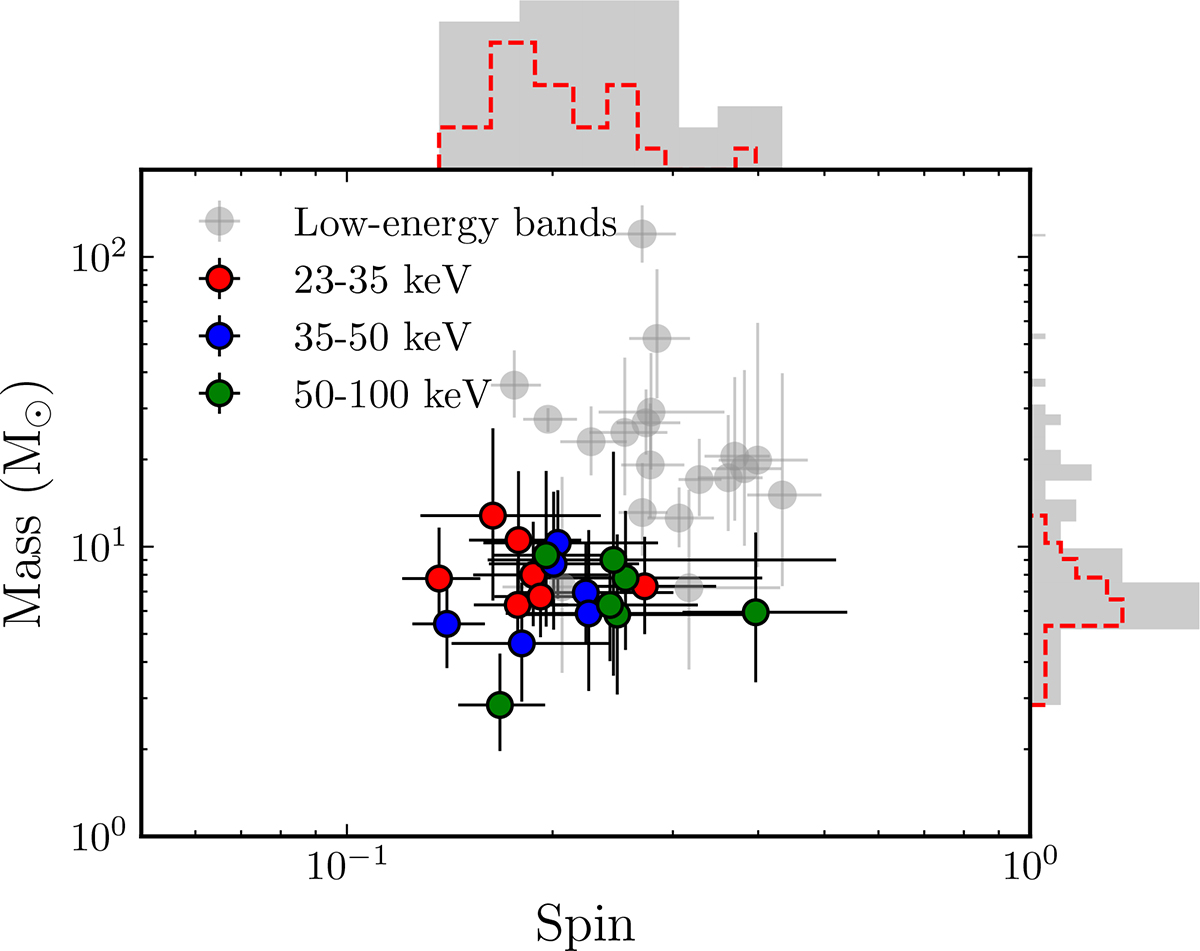
Fig. 7.
Download original image
Mass and spin estimates derived from the RPM using the triplets composed of a type-C QPO and two high-frequency humps. The gray points represent the spin and mass values obtained using the triples from the energy bands below 23 keV. The distributions of the spin and mass can be seen at the top and to the right of the figure. The gray areas correspond to the distribution of the full-energy bands, while the dashed red lines represent the distribution considering only the high-energy bands above 23 keV.
Current usage metrics show cumulative count of Article Views (full-text article views including HTML views, PDF and ePub downloads, according to the available data) and Abstracts Views on Vision4Press platform.
Data correspond to usage on the plateform after 2015. The current usage metrics is available 48-96 hours after online publication and is updated daily on week days.
Initial download of the metrics may take a while.