Fig. 8.
Download original image
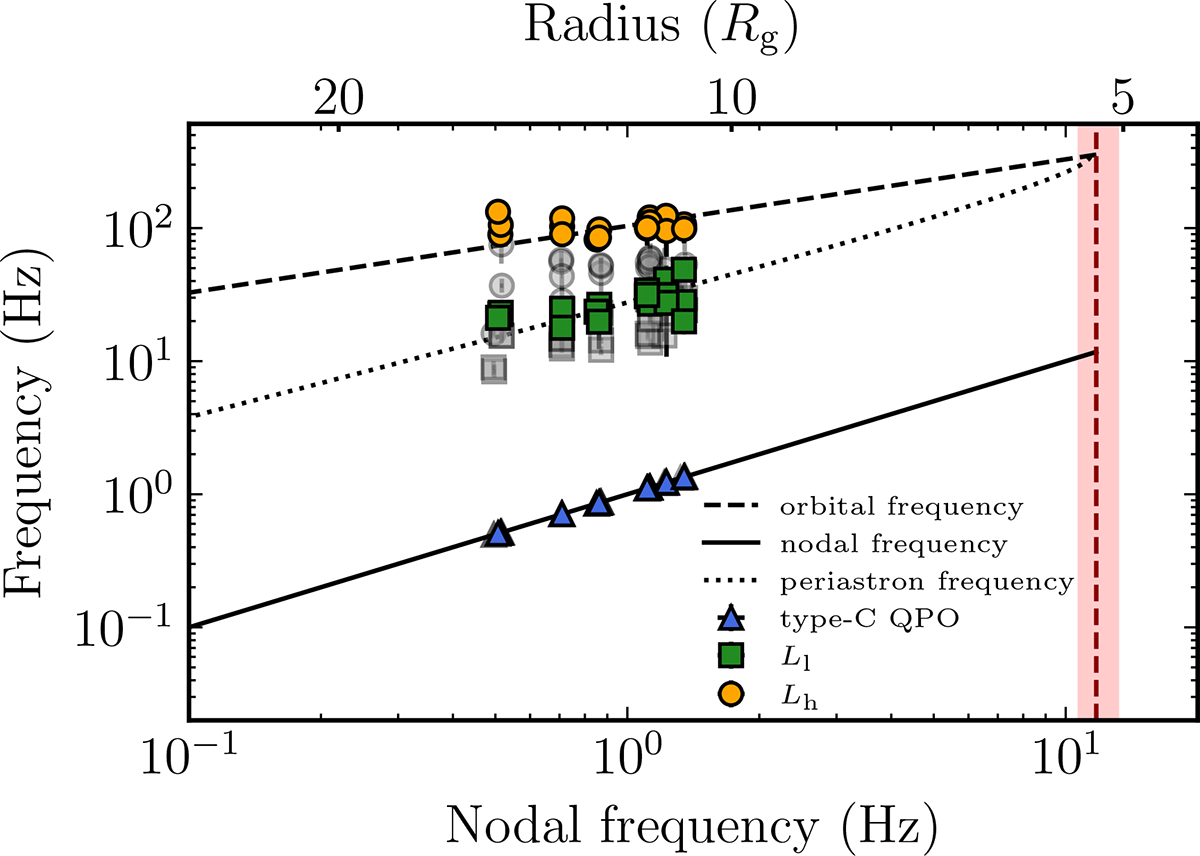
Nodal precession frequency (solid line), periastron precession frequency (dotted line), and orbital frequency (dashed line) as a function of the nodal precession frequency as predicted by the RPM. The lines are drawn for mass M = 7.12 M⊙ and spin a = 0.20. The corresponding radii are given in the top x-axis. The blue triangles represent the characteristic frequencies of the type-C QPO of high-energy data. The green squares and yellow circles mark the characteristic frequencies of the two high-frequency humps, Ll and Lh. Additionally, the gray triangles, squares, and circles denote the characteristic frequencies of the type-C QPO, Ll, and Lh in the low-energy band, respectively. The vertical dashed line represents the nodal precession frequency at the ISCO, where the Keplerian frequency equals the periastron precession frequency and the vertical red band indicates its corresponding 1σ uncertainty.
Current usage metrics show cumulative count of Article Views (full-text article views including HTML views, PDF and ePub downloads, according to the available data) and Abstracts Views on Vision4Press platform.
Data correspond to usage on the plateform after 2015. The current usage metrics is available 48-96 hours after online publication and is updated daily on week days.
Initial download of the metrics may take a while.