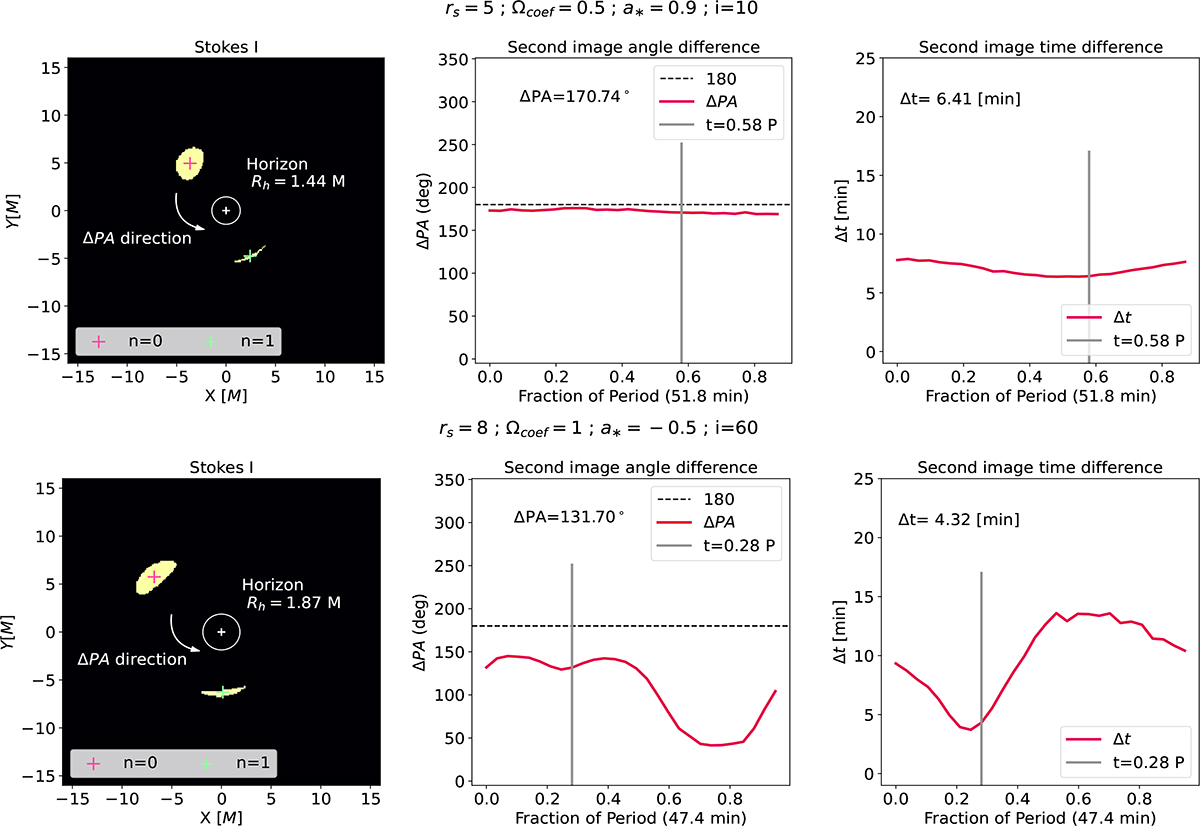
Fig. 1.
Download original image
Left: Snapshot from a hot spot movie, with resolution 256 × 256 (as in the entire library), where ΔPA is calculated from the primary to the secondary counterclockwise. Middle: Curve of ΔPA measurement with respect to time for a full period. Right: Time lag (difference in arrival times) between the first and second image. The gray vertical line in the right panels denotes the snapshot’s time in the left panels.
Current usage metrics show cumulative count of Article Views (full-text article views including HTML views, PDF and ePub downloads, according to the available data) and Abstracts Views on Vision4Press platform.
Data correspond to usage on the plateform after 2015. The current usage metrics is available 48-96 hours after online publication and is updated daily on week days.
Initial download of the metrics may take a while.