Open Access
Fig. 3.
Download original image
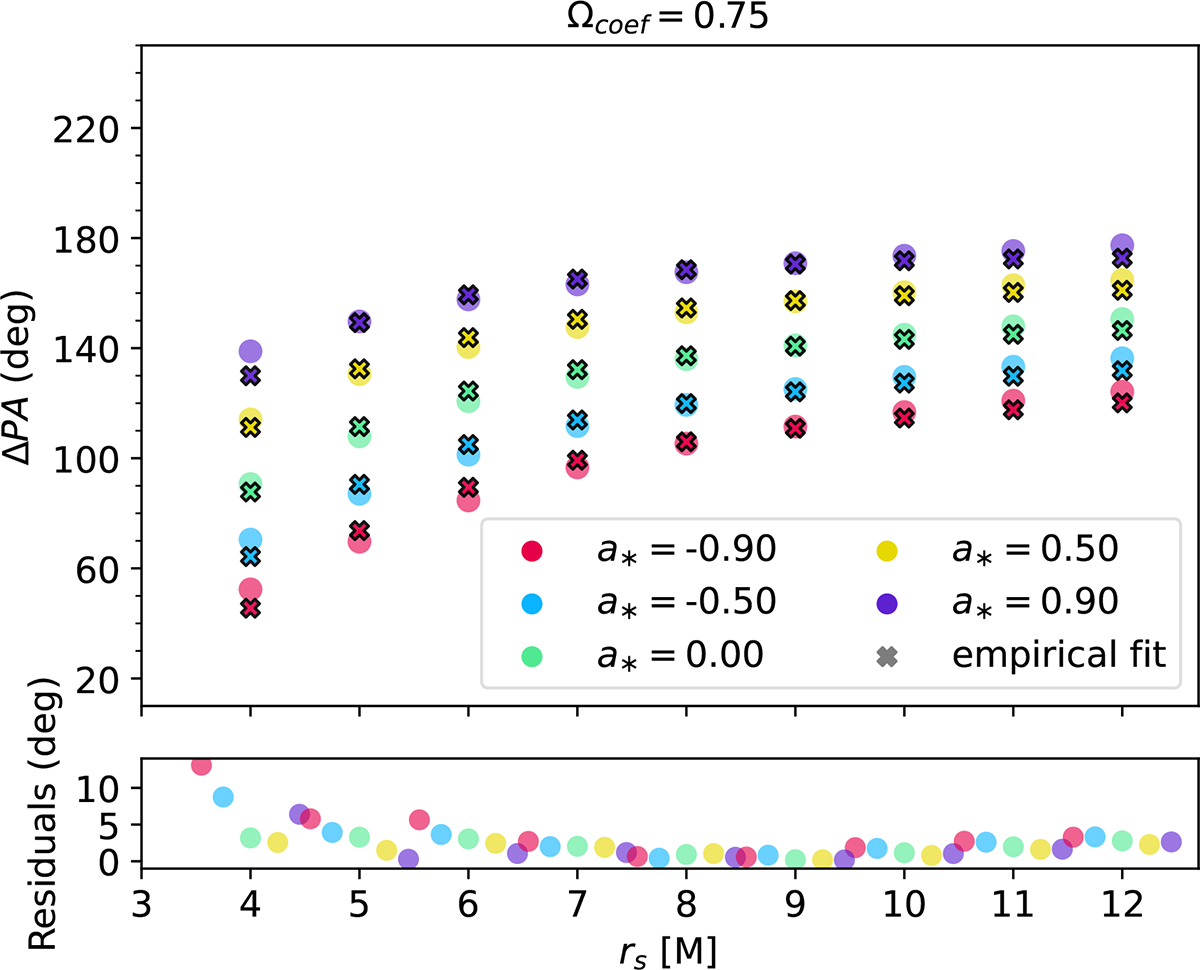
Top: Mean ΔPA values (from a full period) for different models in our library, overlaid with our empirical fitting relation. Bottom: Residuals (percentage difference between ΔPA and δPA0 → 1), where for every radius the spin values have been expanded horizontally for clarity.
Current usage metrics show cumulative count of Article Views (full-text article views including HTML views, PDF and ePub downloads, according to the available data) and Abstracts Views on Vision4Press platform.
Data correspond to usage on the plateform after 2015. The current usage metrics is available 48-96 hours after online publication and is updated daily on week days.
Initial download of the metrics may take a while.