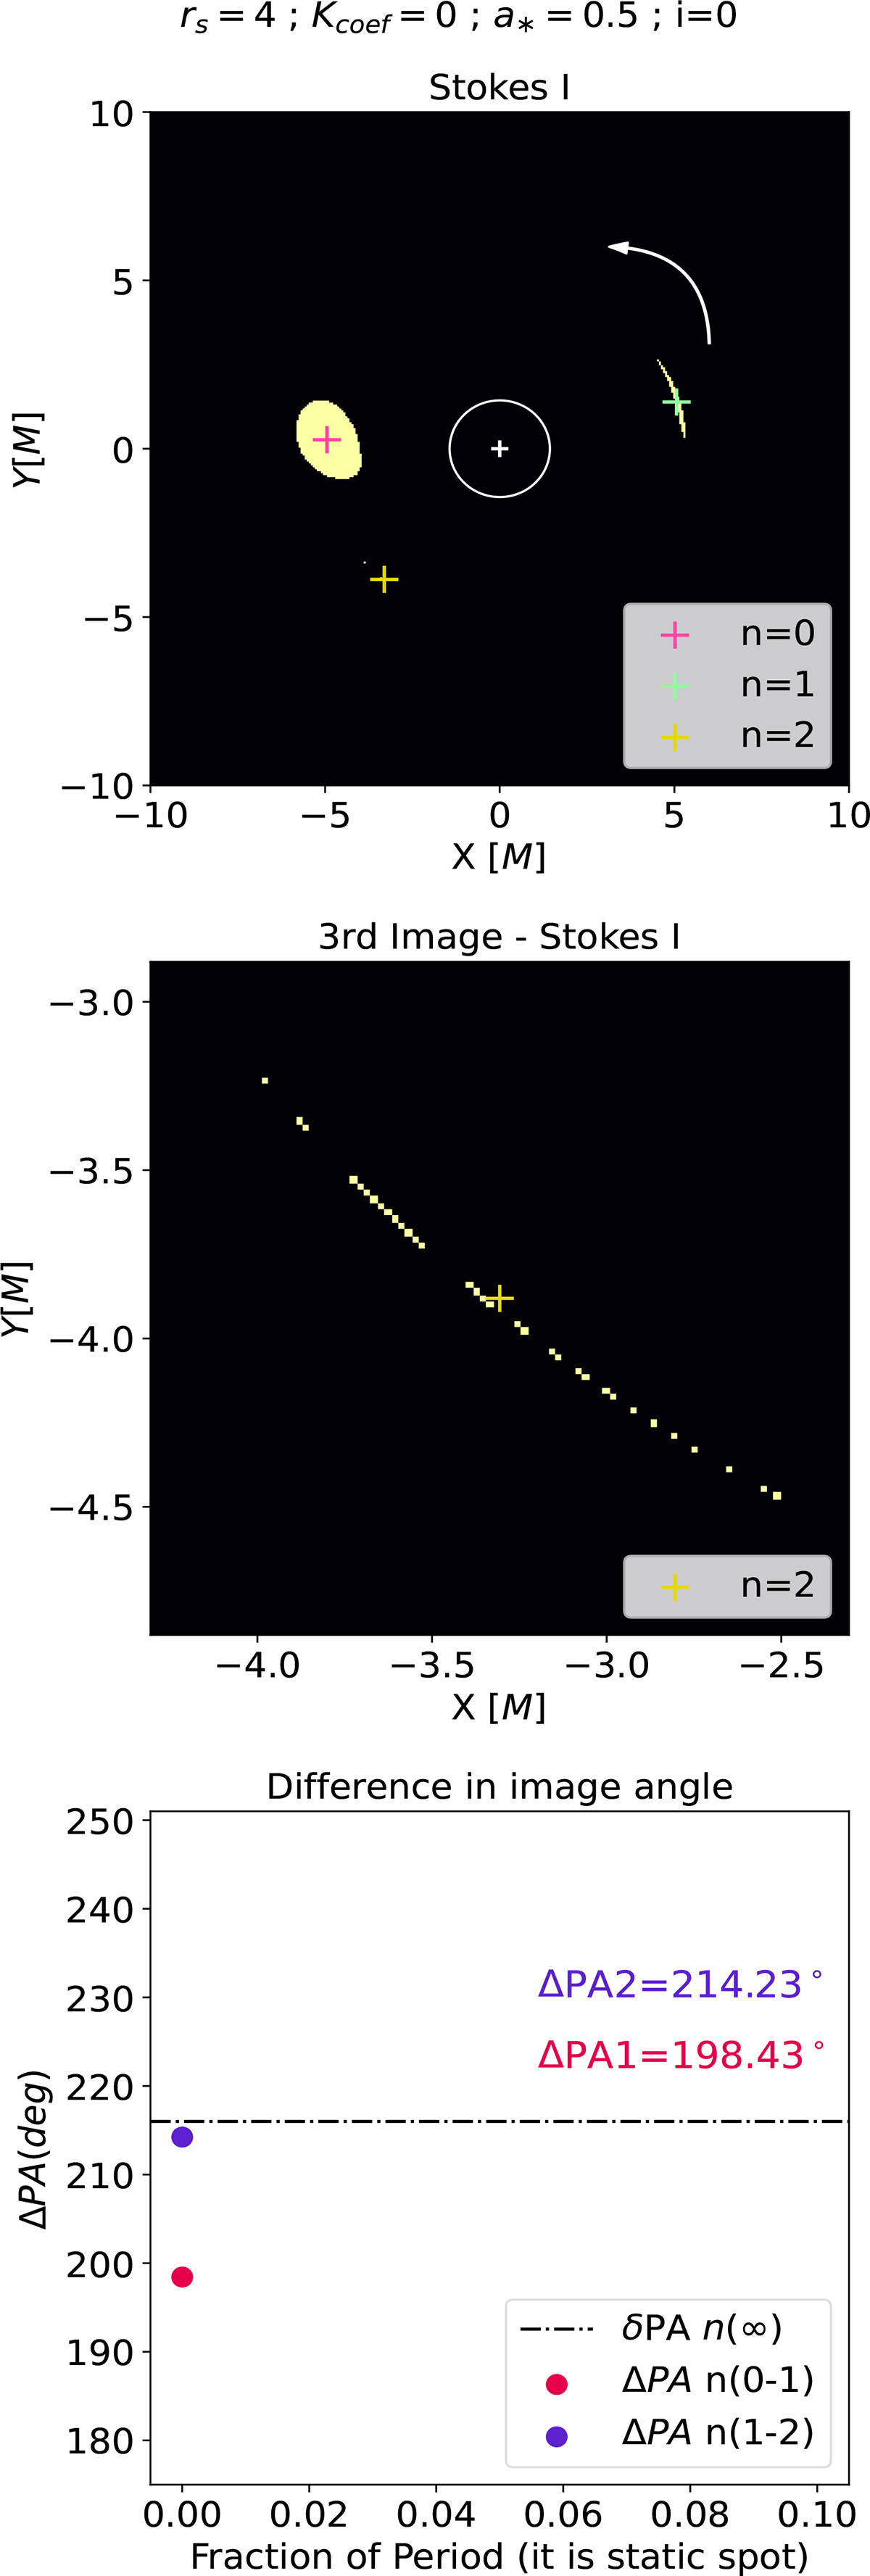
Fig. A.2.
Download original image
Top: Snapshot from a non-moving hot spot, using a higher resolution of 1024x1024 pixels, to resolve the third image. Middle: Zoomed-in view of the third image. Bottom: ΔPA n(0 − 1) measurement from the first to the second image, and ΔPA n(1 − 2) from the second to the third. The dash-point line denotes the theoretical expectation δPA(n → ∞).
Current usage metrics show cumulative count of Article Views (full-text article views including HTML views, PDF and ePub downloads, according to the available data) and Abstracts Views on Vision4Press platform.
Data correspond to usage on the plateform after 2015. The current usage metrics is available 48-96 hours after online publication and is updated daily on week days.
Initial download of the metrics may take a while.