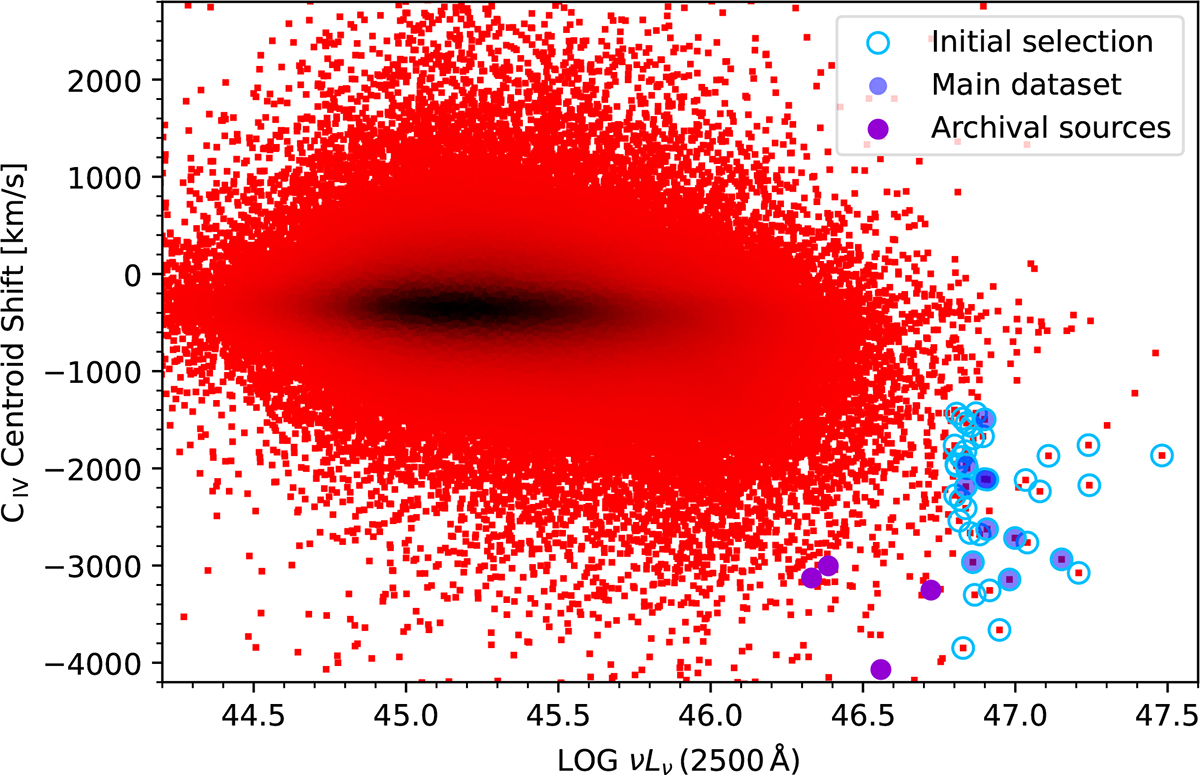
Fig. 1.
Download original image
Shift of centroid of C IVλ1549 Å line in units of km/s, as function of logarithmic luminosity νLν at 2500 Å, available in Wu & Shen (2022). The sample consists of all the quasars in the SDSS DR16 sample with redshift in the z = 1.8–2.2 interval, colour-coded from red to black by the density of the underlying points. Empty cyan circles indicate 45 objects pre-selected for the one-by-one modelling of the C IV line with multiple components. Filled semi-transparent blue circles show a subset of 10 objects with the confirmed strongly blueshifted component, the main dataset analysed in this paper. Violet circles show four supplementary archival sources.
Current usage metrics show cumulative count of Article Views (full-text article views including HTML views, PDF and ePub downloads, according to the available data) and Abstracts Views on Vision4Press platform.
Data correspond to usage on the plateform after 2015. The current usage metrics is available 48-96 hours after online publication and is updated daily on week days.
Initial download of the metrics may take a while.