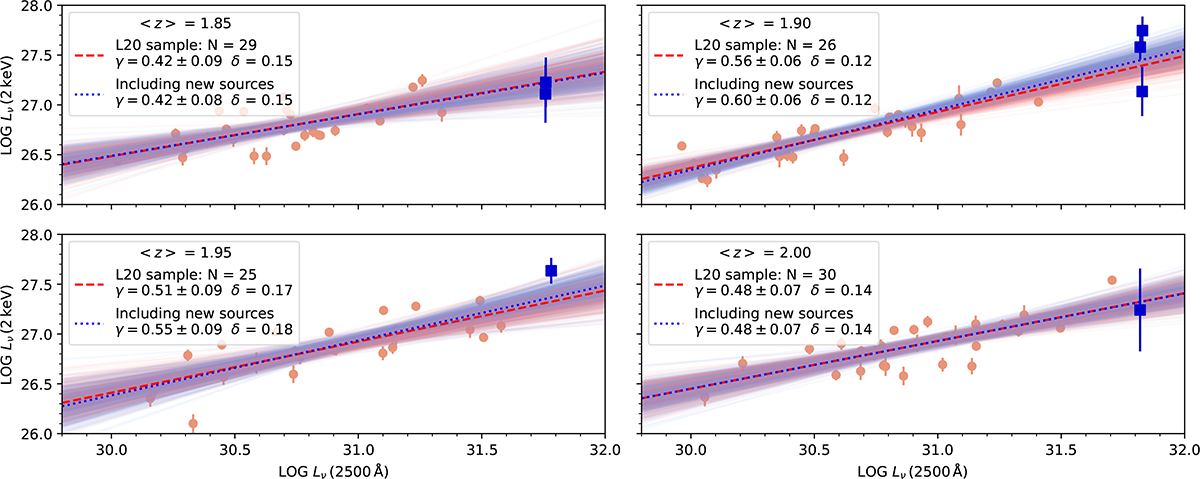
Fig. C.1.
Download original image
Rest-frame monochromatic luminosities LX against LUV in Δz = 0.05 redshift bins. Light red dots represent quasars from the Lusso et al. (2020) sample, with the relative regression lines shown in dashed red. Blue squares represent seven X-ray steep (Γ > 1.7) quasars in our main dataset, with the updated regression lines shown in dotted blue.
Current usage metrics show cumulative count of Article Views (full-text article views including HTML views, PDF and ePub downloads, according to the available data) and Abstracts Views on Vision4Press platform.
Data correspond to usage on the plateform after 2015. The current usage metrics is available 48-96 hours after online publication and is updated daily on week days.
Initial download of the metrics may take a while.