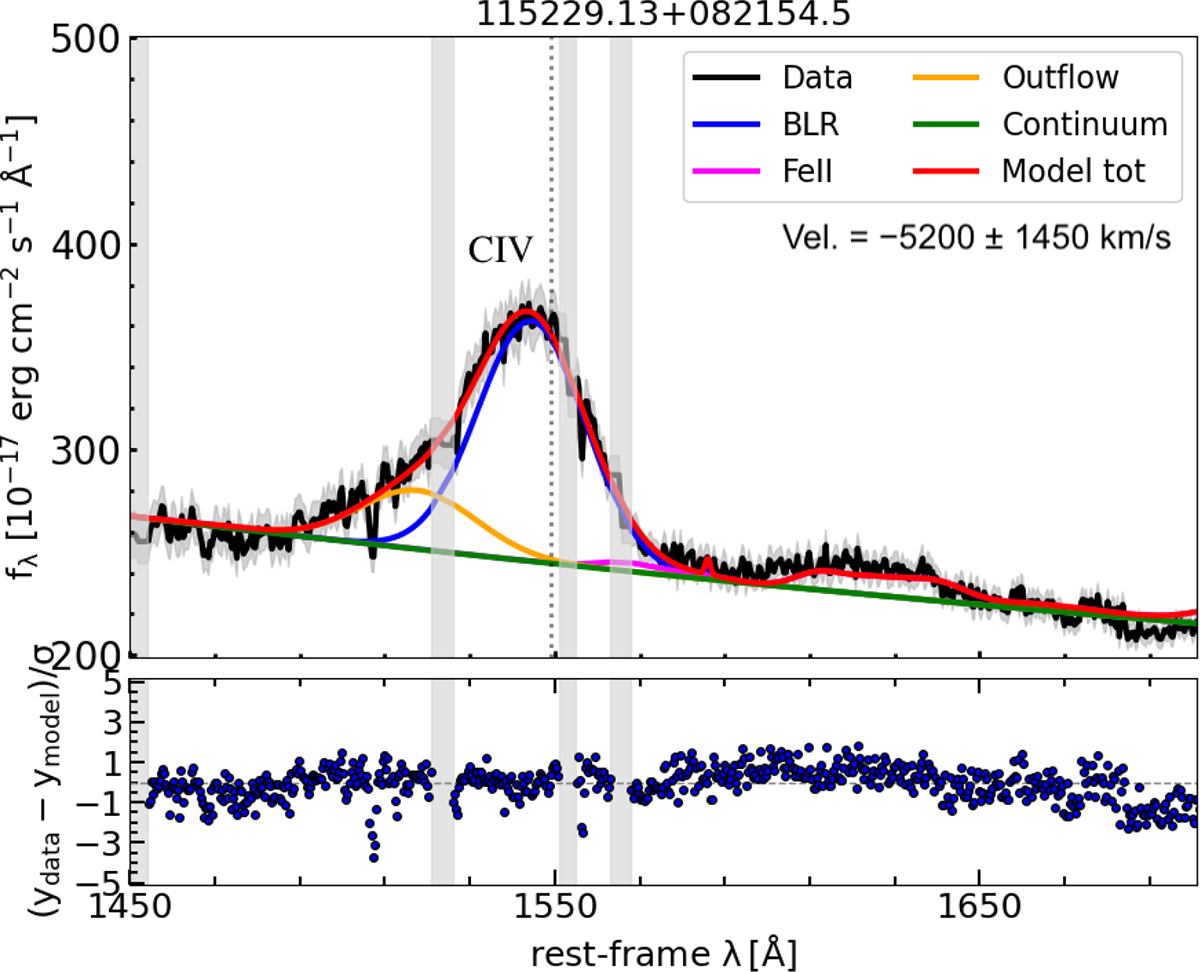
Fig. 2.
Download original image
Example of analysis of C IV spectral region of SDSS spectra. The fitted lines are reported as labels. The components employed in the fit are colour-coded, as shown in the legend. The reported C IV outflow velocity is measured as the shift of the outflow component with respect to the BLR component. The dashed vertical lines indicate the expected position for the fitted lines according to the redshift reported in the catalogue. The shaded light grey regions are telluric bands, narrow absorption lines, or bad pixels and are therefore excluded from the fit. See Appendix A for the analysis of other sources.
Current usage metrics show cumulative count of Article Views (full-text article views including HTML views, PDF and ePub downloads, according to the available data) and Abstracts Views on Vision4Press platform.
Data correspond to usage on the plateform after 2015. The current usage metrics is available 48-96 hours after online publication and is updated daily on week days.
Initial download of the metrics may take a while.