Open Access
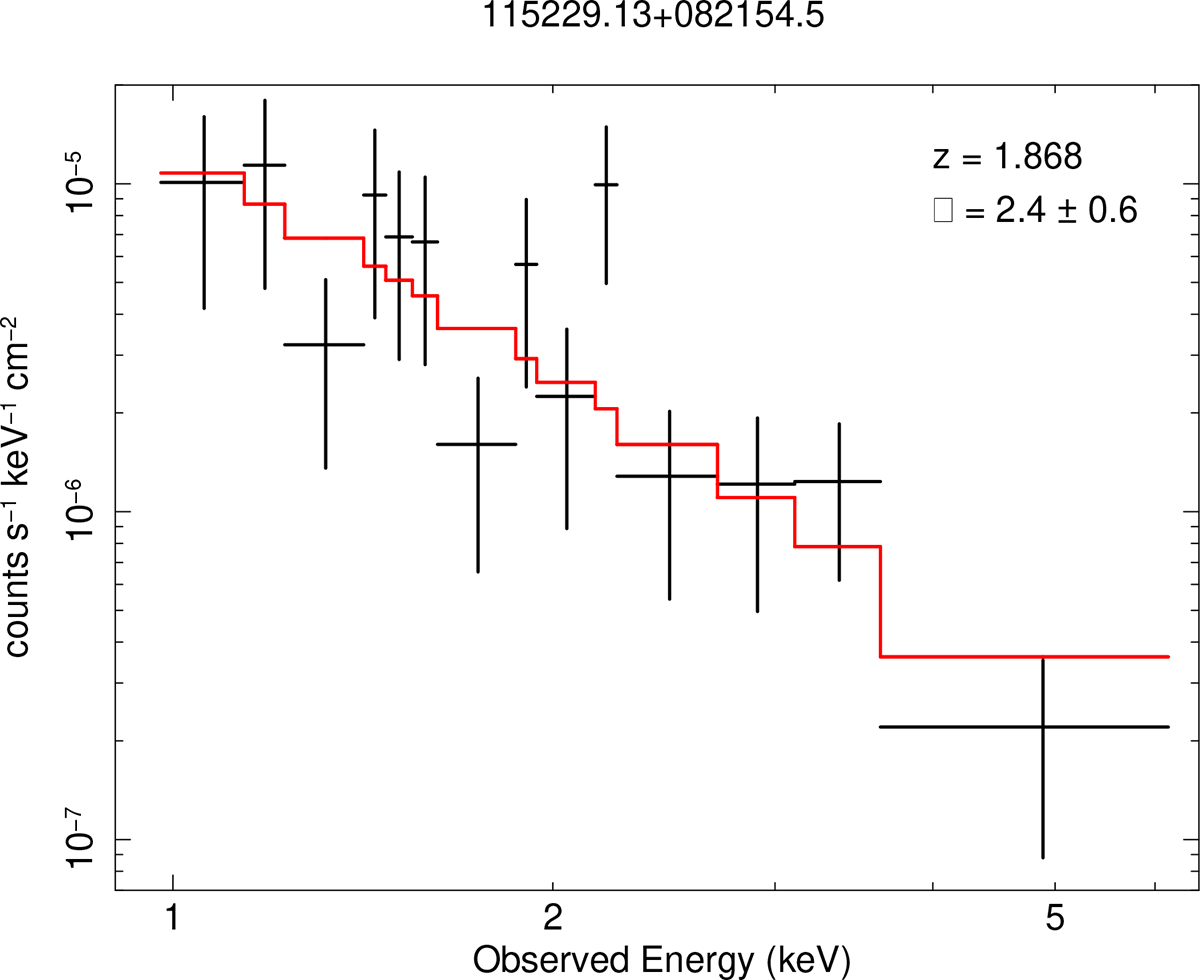
Fig. 4.
Download original image
Example of analysis of Chandra X-ray spectra. To enhance visual clarity, the spectrum in the plot is binned to ensure at least 1.5 counts per energy channel. Black crosses represent the observational data with corresponding errors, red line represents the best-fit model. See Appendix B for the analysis of other sources.
Current usage metrics show cumulative count of Article Views (full-text article views including HTML views, PDF and ePub downloads, according to the available data) and Abstracts Views on Vision4Press platform.
Data correspond to usage on the plateform after 2015. The current usage metrics is available 48-96 hours after online publication and is updated daily on week days.
Initial download of the metrics may take a while.