Fig. 5.
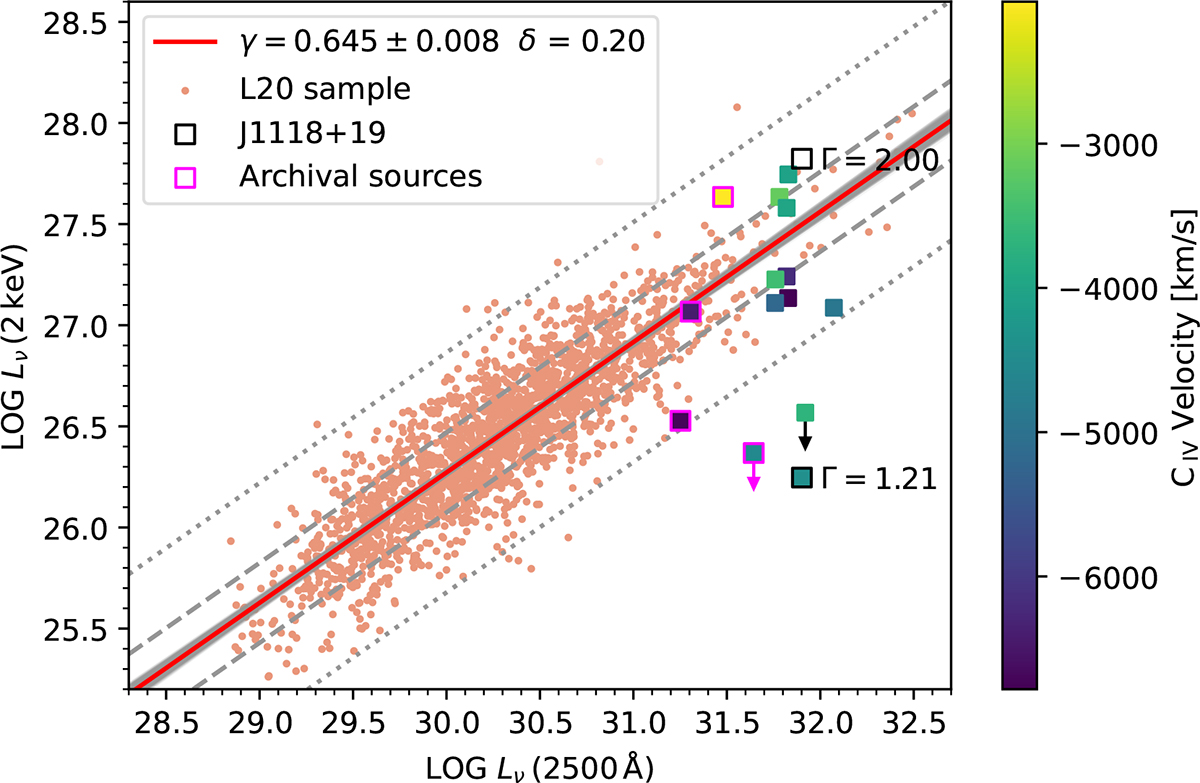
Download original image
Rest-frame monochromatic luminosities LX against LUV for 10 quasars in our main dataset and four additional quasars from Chandra and XMM-Newton archives, colour-coded by C IV outflow velocity in units of km/s, measured in our modelling of C IV line as the shift of the outflow component with respect to the BLR component. Colour-coded and empty black squares show modelling of J111800.50+195853.4 with a free and fixed photon index, respectively. Downward arrows indicate non-detection, and the corresponding squares represent upper limits. Light red dots represent the sample of about 2000 quasars from Lusso et al. (2020), with the relative regression line in red, for which the slope γ, with its error, and the dispersion δ are specified. The dashed and dotted lines trace the 1σ and 3σ dispersion, respectively.
Current usage metrics show cumulative count of Article Views (full-text article views including HTML views, PDF and ePub downloads, according to the available data) and Abstracts Views on Vision4Press platform.
Data correspond to usage on the plateform after 2015. The current usage metrics is available 48-96 hours after online publication and is updated daily on week days.
Initial download of the metrics may take a while.