Fig. 1
Download original image
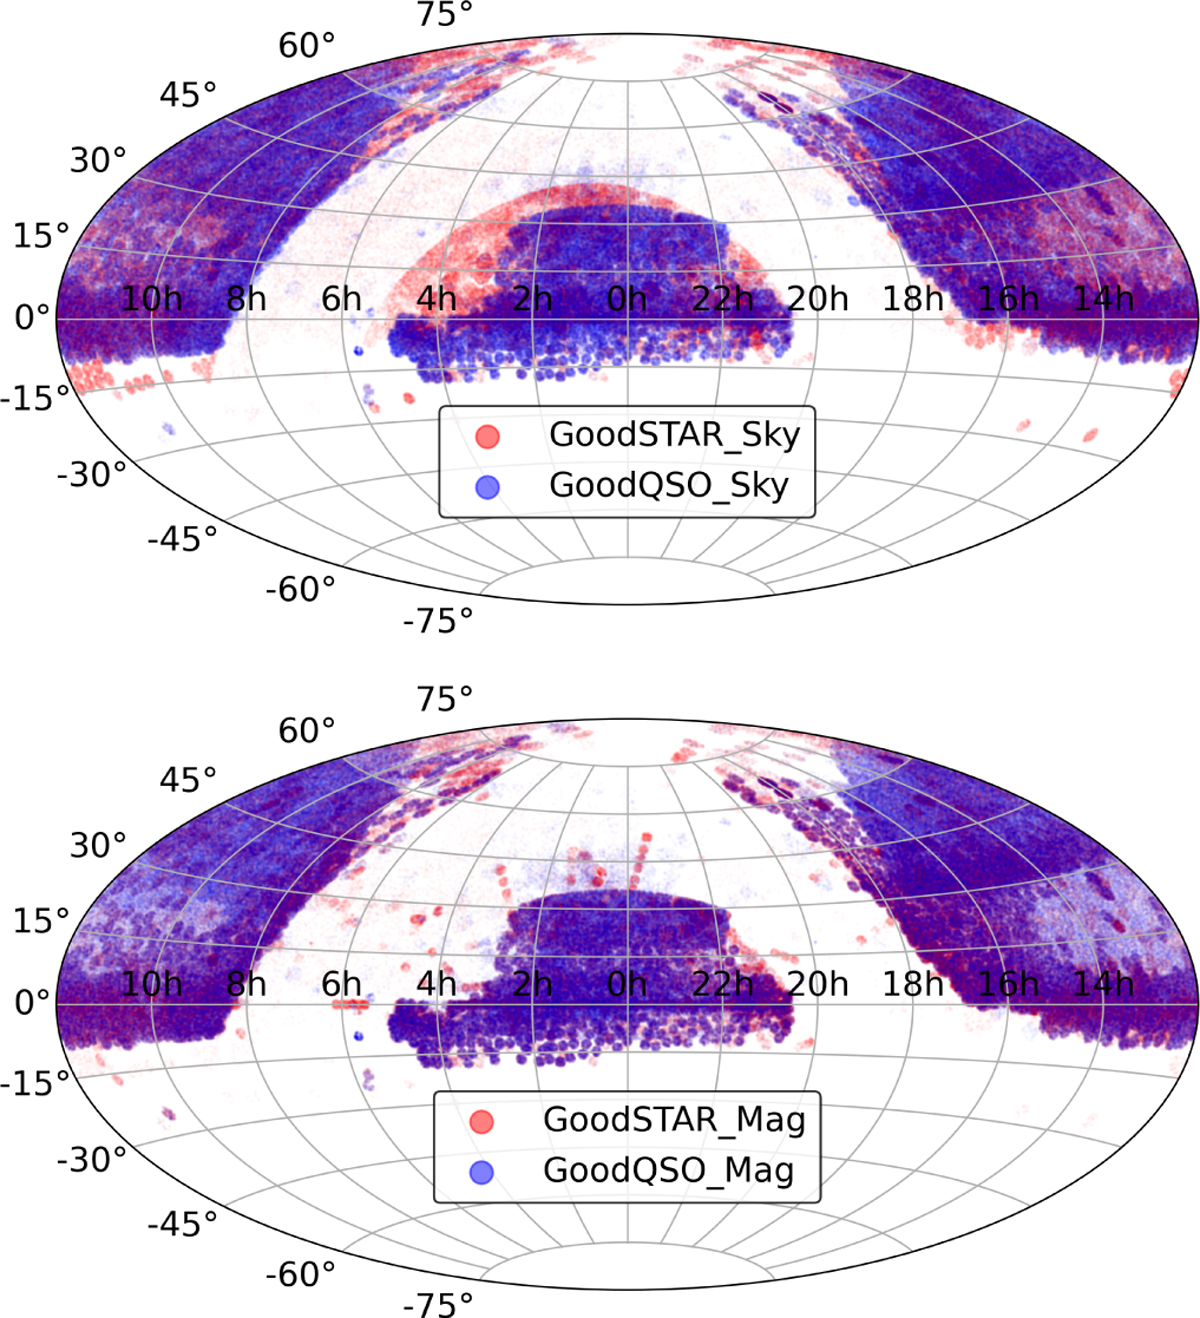
Hammer–Aitoff equatorial projection of sky region binned (top panel) and Gaia G-band magnitude binned (bottom panel) reference samples. The blue scatters in the top and bottom panels represent the GoodQSO_Sky and GoodQSO_Mag, respectively. The red scatters in the top and bottom panels represent the GoodSTAR_Sky and GoodSTAR_Mag, respectively.
Current usage metrics show cumulative count of Article Views (full-text article views including HTML views, PDF and ePub downloads, according to the available data) and Abstracts Views on Vision4Press platform.
Data correspond to usage on the plateform after 2015. The current usage metrics is available 48-96 hours after online publication and is updated daily on week days.
Initial download of the metrics may take a while.