Fig. 12
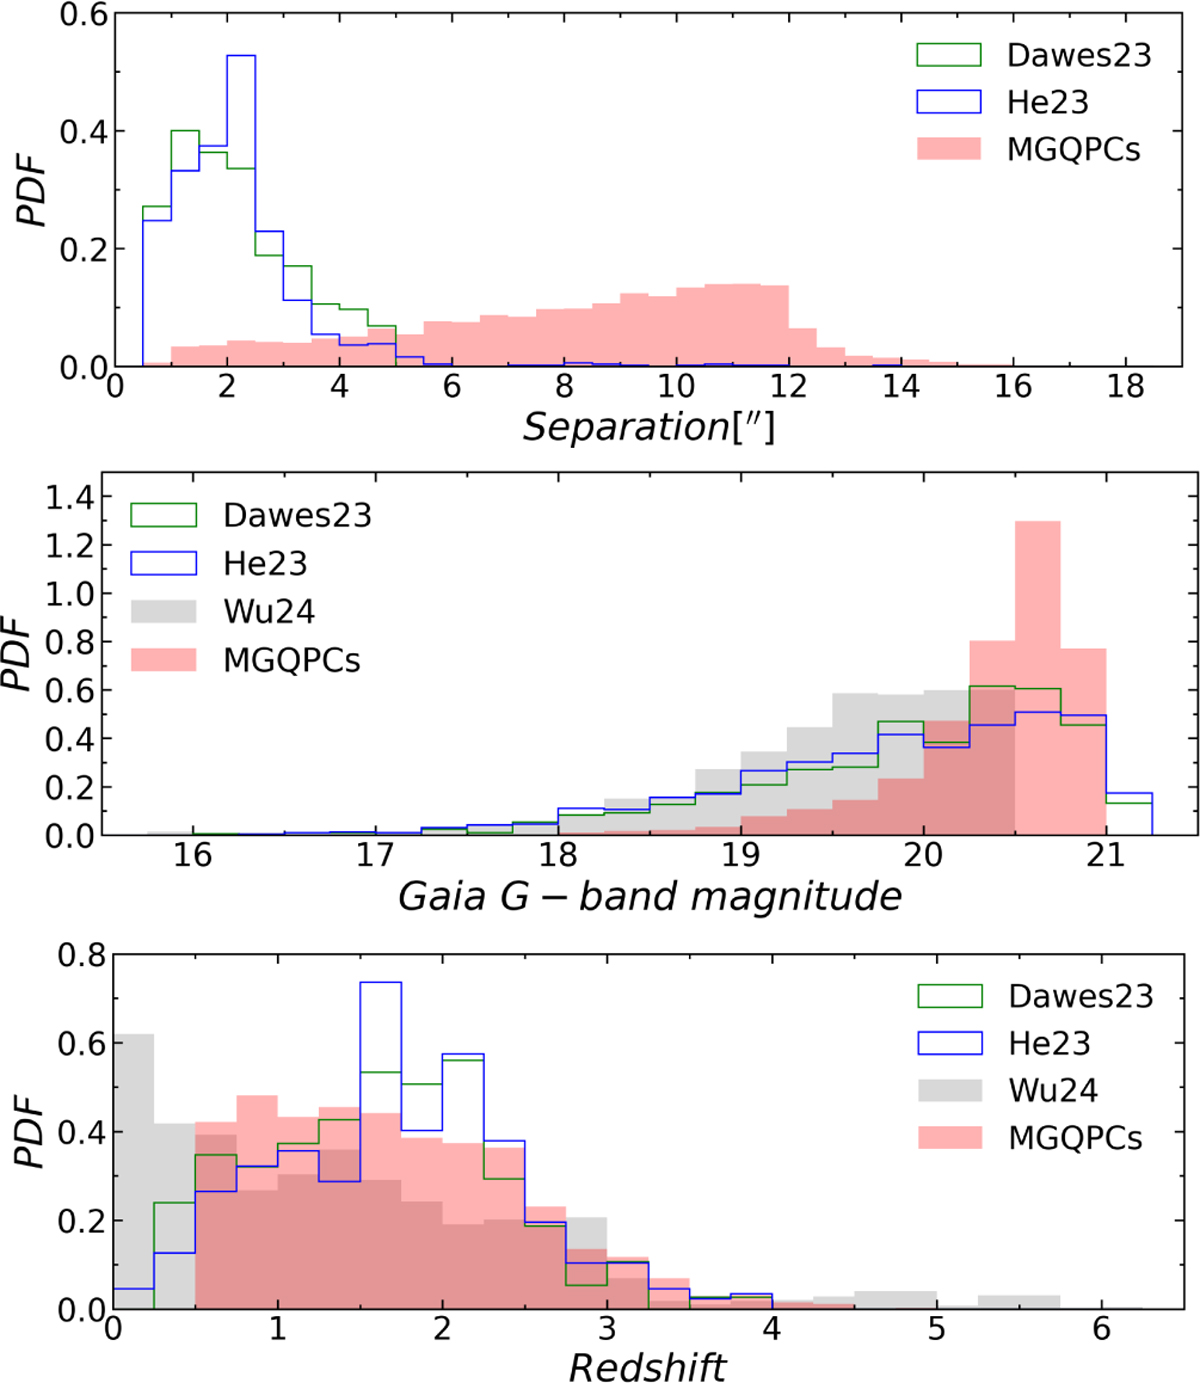
Download original image
Comparison of Dawes23 (green unfilled), He23 (blue unfilled), Wu24 (gray filled), and the MGQPC catalog (red filled) on the distributions of the member separation, Gaia G-band magnitude, and redshift. The y-axes are all scaled as probability distribution functions (PDF) to exhibit the distribution characteristics of the three parameters intuitively. Top panel: Separation histograms of Dawes23, He23, and the MGQPC catalog. Middle panel: Gaia G-band magnitude histograms of the four catalogs. Bottom panel: Redshift histograms of the four catalogs.
Current usage metrics show cumulative count of Article Views (full-text article views including HTML views, PDF and ePub downloads, according to the available data) and Abstracts Views on Vision4Press platform.
Data correspond to usage on the plateform after 2015. The current usage metrics is available 48-96 hours after online publication and is updated daily on week days.
Initial download of the metrics may take a while.