Fig. 2
Download original image
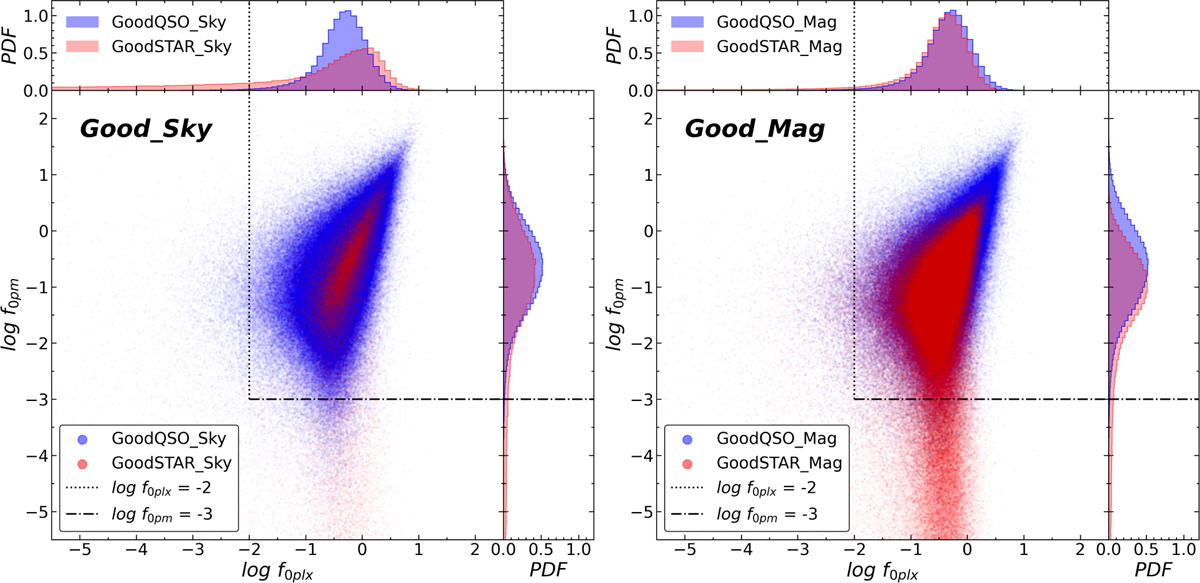
log f0pm vs. log f0plx distributions of the Good_Sky (left panel) and Good_Mag (right panel), along with the quasar selection regions of the adopted astrometric criteria. The left panel shows the distributions of the sky-unbinned GoodQSO_Sky (blue points) and GoodSTAR_Sky (red points), while the right panel displays the corresponding distributions for the magnitude-unbinned GoodQSO_Mag (blue) and GoodSTAR_Mag (red). The black dotted dashed lines represent the f0pm criteria, while the dotted ones represent the f0plx criteria. All the histograms are normalized as probability density distributions (PDFs). Due to the long-tailed distributions of stars in log f0pm and log f0plx, i.e., many stars fall outside the plot range, both subplots display only small portions of the entire distributions.
Current usage metrics show cumulative count of Article Views (full-text article views including HTML views, PDF and ePub downloads, according to the available data) and Abstracts Views on Vision4Press platform.
Data correspond to usage on the plateform after 2015. The current usage metrics is available 48-96 hours after online publication and is updated daily on week days.
Initial download of the metrics may take a while.