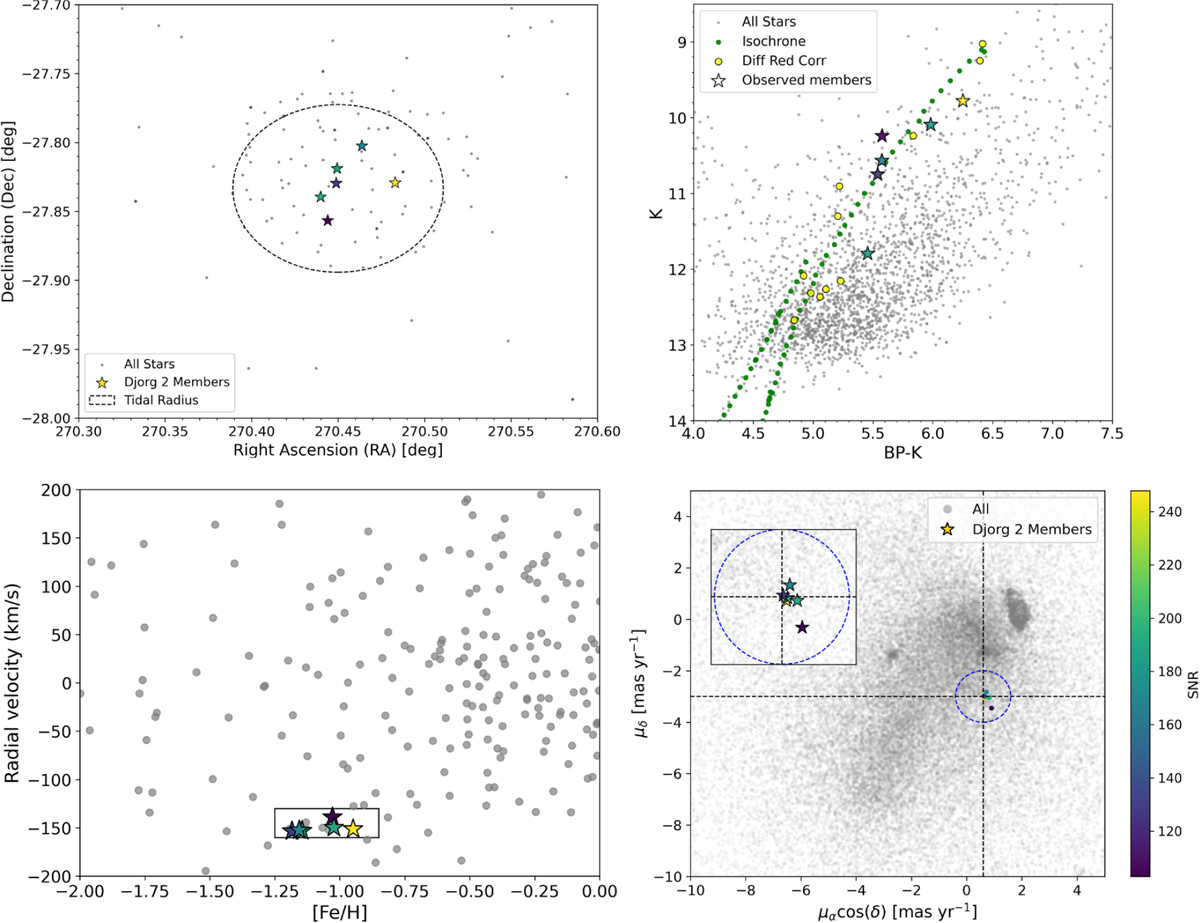
Fig. 1
Download original image
Global properties of the Djorg 2 targets. In all the panels, our targets are represented using a star-symbol. Top left panel: spatial position. The color-coded symbols represent the S/R of the stars (labeled in bottom left panel) with APOGEE spectra. Other APOGEE targets in the field are shown as gray dots. A circle with the tidal radius (Harris 2010) is overplotted. Bottom-left panel: radial velocity vs. metallicity of our members compared to field stars. The black box encloses the cluster members within 0.2 dex and 15 km/s from the nominal mean [Fe/H]=–1.04 dex and RV=–149.8 km/s, as determined in this work. Top-right panel: color–magnitude diagram corrected for differential reddening in the Gaia Bp and 2MASS K bands within 5’. Our targets all lie along the red giant branch. The best isochrone fit is represented by green circles. Field stars are plotted as gray dots. Bottom-right panel: proper motion density distribution of stars located within the tidal radius from the cluster center. The inner plot in the top left corner shows a zoom-in of the cluster squared in 0.7 × 0.7 mas yr−1 and enclosed in a proper motion radius of 0.5 mas yr−1, shown as a blue circle. The dashed gray lines are centered on the cluster center PM values and PM-based cluster members are indicated as yellow circles.
Current usage metrics show cumulative count of Article Views (full-text article views including HTML views, PDF and ePub downloads, according to the available data) and Abstracts Views on Vision4Press platform.
Data correspond to usage on the plateform after 2015. The current usage metrics is available 48-96 hours after online publication and is updated daily on week days.
Initial download of the metrics may take a while.