Fig. 1
Download original image
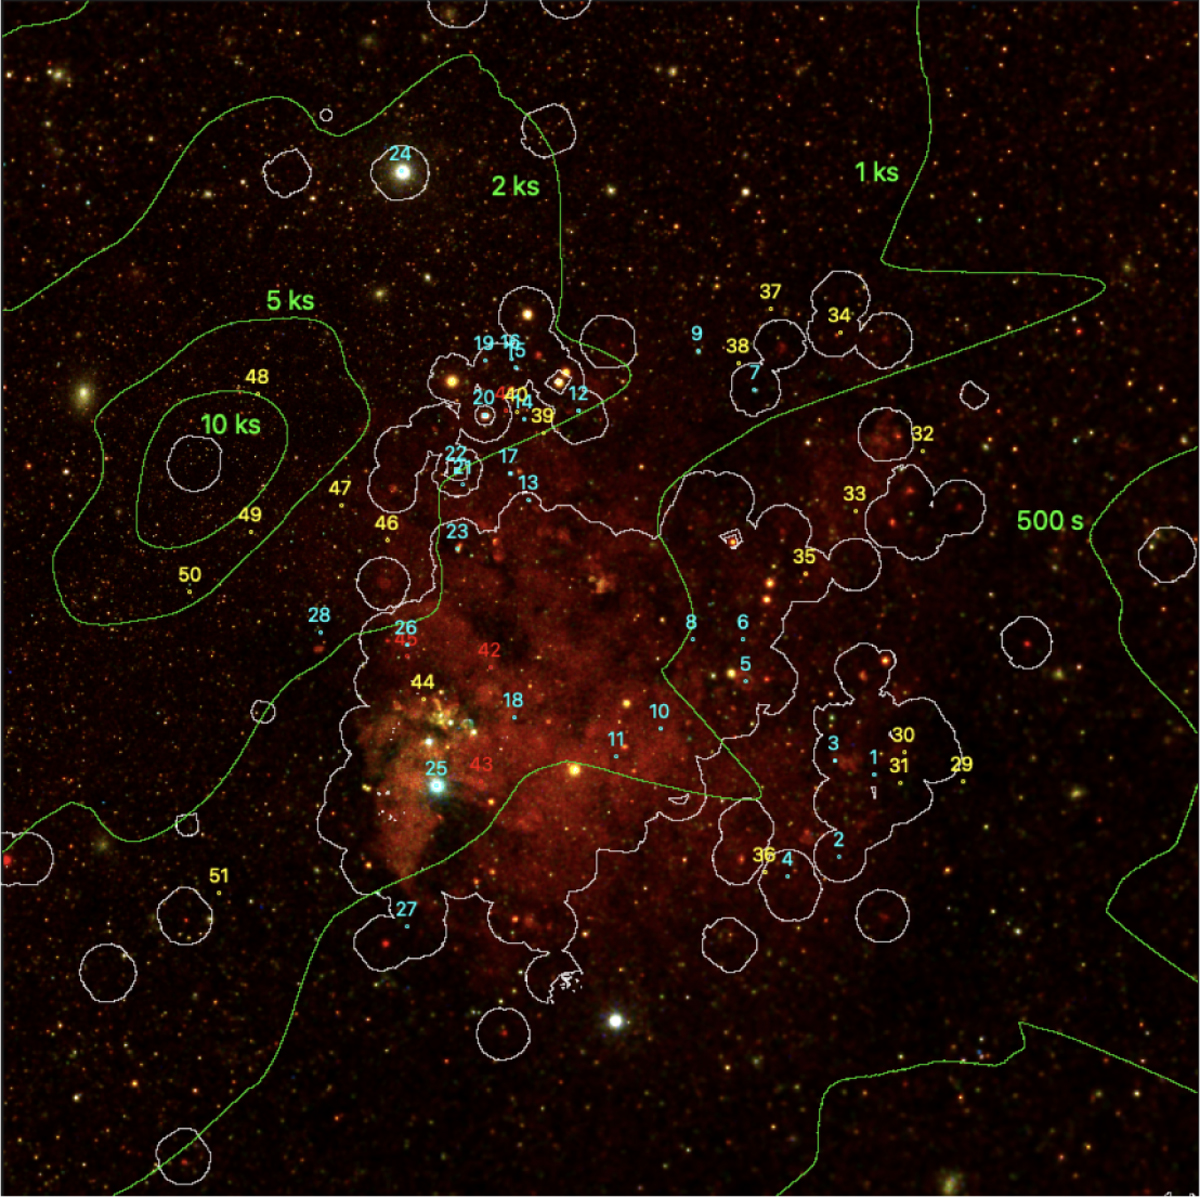
RGB (r: 0.2−1.0 keV, g: 1.0−2.0 keV, b: 2.0−4.5 keV) of LMC during eRASS 1. The green contours show the total exposure achieved with eRASS1. The exposure maximum lies at the SEP. Cyan markers represent known HMXBs. Red and yellow markers show candidates, representing previously known objects and those discovered with eROSITA, respectively. Labels refer to the sequence numbers in Table 5. The entire region visible in the image, except for the top corners, was investigated during our analysis. White contours indicate the LMC coverage by XMM-Newton. Remarkably, the central LMC has been thoroughly observed by XMM-Newton, while the outskirts remain under-sampled.
Current usage metrics show cumulative count of Article Views (full-text article views including HTML views, PDF and ePub downloads, according to the available data) and Abstracts Views on Vision4Press platform.
Data correspond to usage on the plateform after 2015. The current usage metrics is available 48-96 hours after online publication and is updated daily on week days.
Initial download of the metrics may take a while.