Fig. 11
Download original image
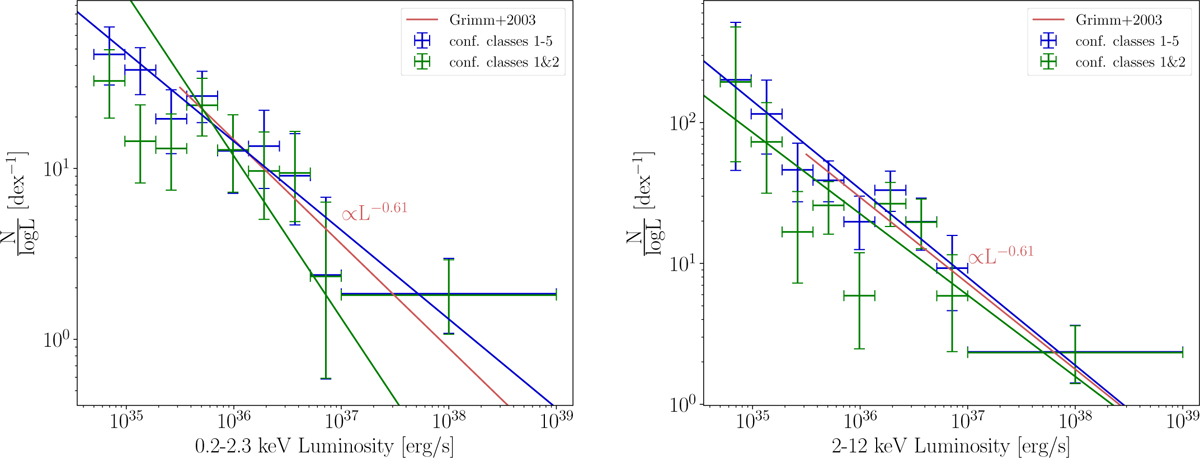
X-ray luminosity functions of HMXB detected during eRASS1. Green and blue points mark the expected number of sources per dex. A Poisson distribution of measured numbers is assumed. The blue and green lines mark the best-fit power-law correlation for the luminosity functions of confidence classes 1−5 and 1 and 2, respectively. The red line marks the universal power-law correlation found by Grimm et al. (2003). Left: HMXB XLF in the detection band of the eRASS1 catalogue scaling catalogue count rates assuming an absorbed power-law model with NH = 6×1020 cm−2 and Γ = 1. Right: extrapolation to 2−12 keV range.
Current usage metrics show cumulative count of Article Views (full-text article views including HTML views, PDF and ePub downloads, according to the available data) and Abstracts Views on Vision4Press platform.
Data correspond to usage on the plateform after 2015. The current usage metrics is available 48-96 hours after online publication and is updated daily on week days.
Initial download of the metrics may take a while.