Fig. 14
Download original image
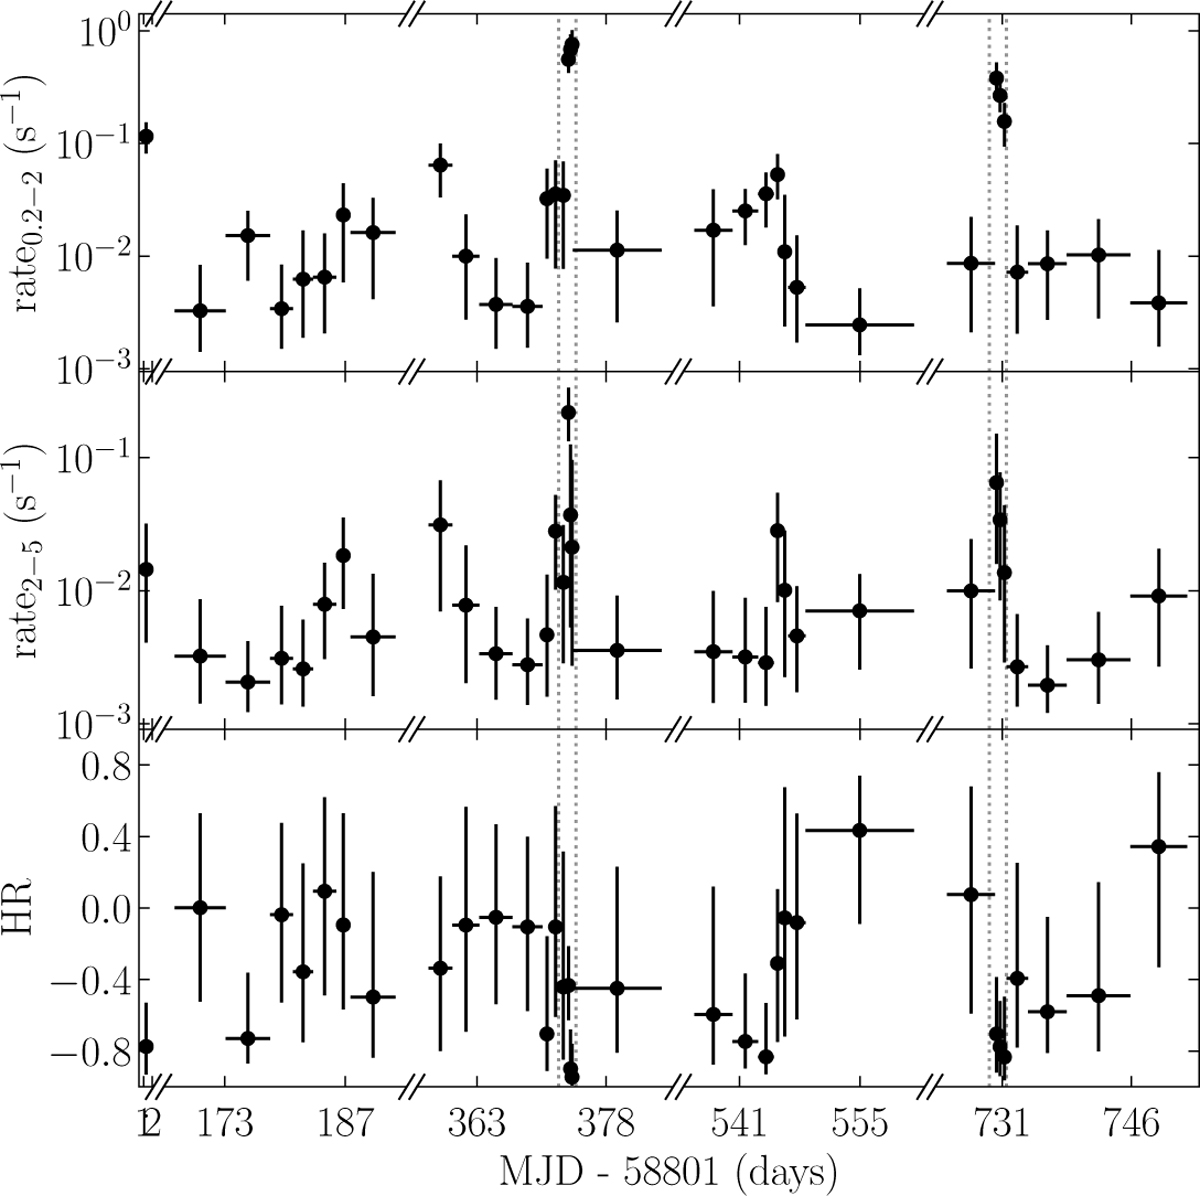
eROSITA light curve of 1eRASS J054422.3−672729 in the energy bands 0.2−2.0 keV (soft; top), 2.0−5.0 keV (hard; middle) and the HR defined from those two bands (bottom). The light curve is binned such that there is a minimum of 1 net count in each band and a minimum of 10 net counts in the sum of the two bands per time bin. The flares at ∼373 and ∼730 days are marked with dotted grey lines and can be best seen in the soft band. The HR light curve indicates spectral softening at those times. Note that time gaps between eRASSs are cut out for readability.
Current usage metrics show cumulative count of Article Views (full-text article views including HTML views, PDF and ePub downloads, according to the available data) and Abstracts Views on Vision4Press platform.
Data correspond to usage on the plateform after 2015. The current usage metrics is available 48-96 hours after online publication and is updated daily on week days.
Initial download of the metrics may take a while.