Open Access
Fig. 15
Download original image
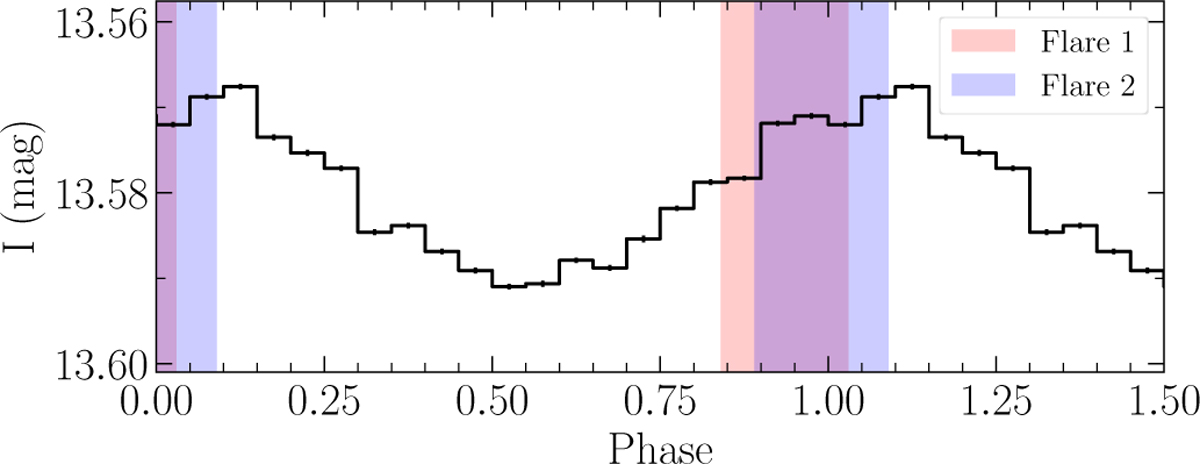
OGLE phase-folded light curve of 1eRASS J054422.3−672729 with timing of the flares marked. Flares 1 and 2 refer to the flares at 373 and 730 days in Fig. 14, respectively.
Current usage metrics show cumulative count of Article Views (full-text article views including HTML views, PDF and ePub downloads, according to the available data) and Abstracts Views on Vision4Press platform.
Data correspond to usage on the plateform after 2015. The current usage metrics is available 48-96 hours after online publication and is updated daily on week days.
Initial download of the metrics may take a while.