Fig. 17
Download original image
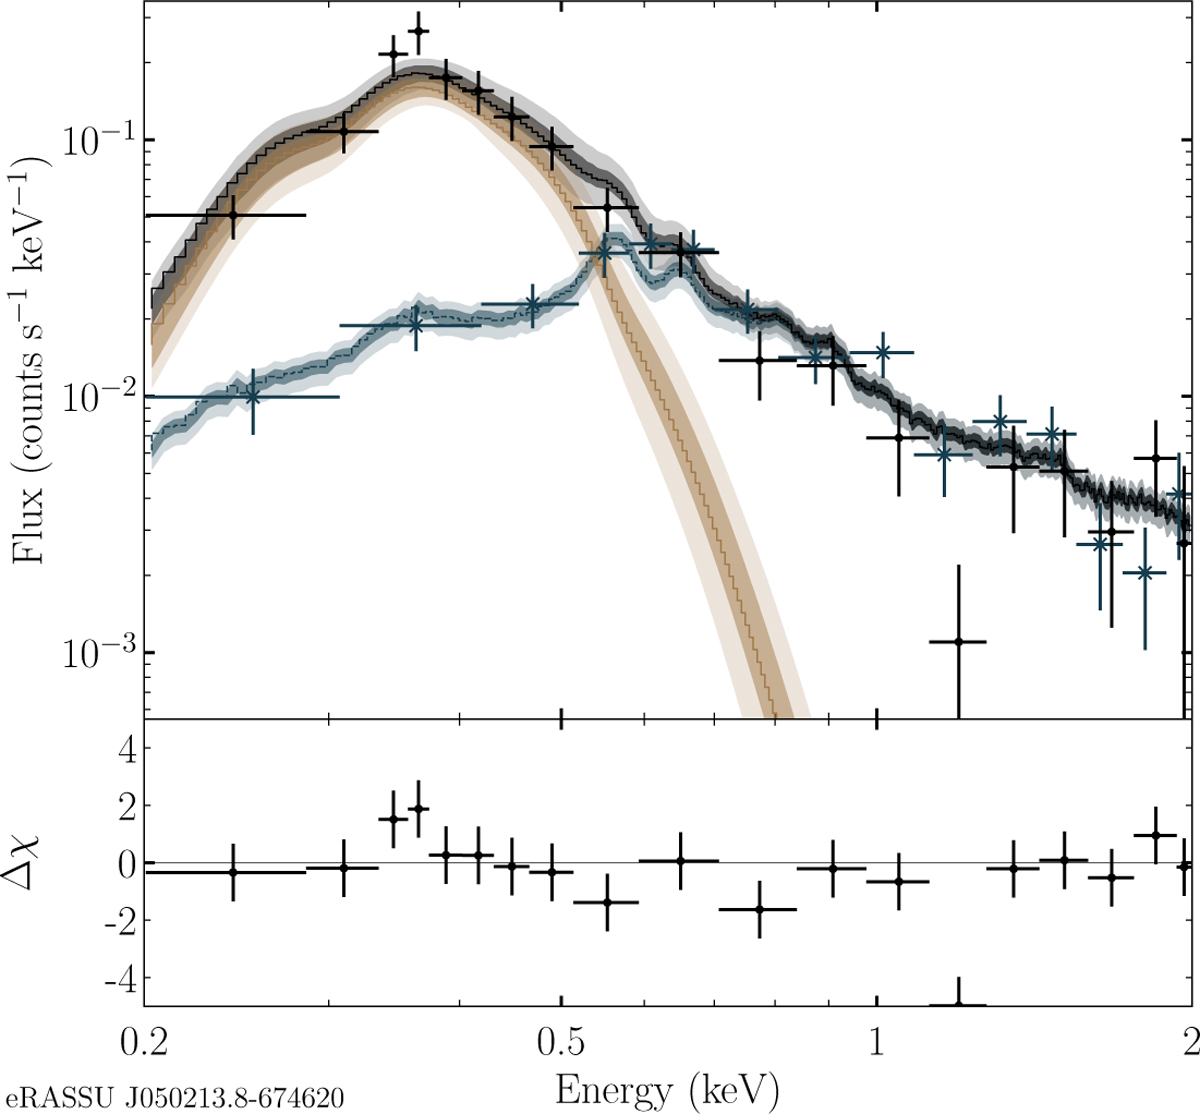
eROSITA spectra of the Be/WD candidate eRASSU J050213.8−674620 merged over all eRASS. Black data points represent the flux in the on-region, while blue data points represent the flux in the off-region, scaled by the size difference between the on- and off-regions. The dark yellow curve represents the best-fit model for the source (absorbed black body), and the shaded areas surrounding it indicate the 1 and 3 sigma regions for the model. The blue curve and shaded area show the best fit for the PCA background model. The black curve and shaded area are the sum of the source and background models.
Current usage metrics show cumulative count of Article Views (full-text article views including HTML views, PDF and ePub downloads, according to the available data) and Abstracts Views on Vision4Press platform.
Data correspond to usage on the plateform after 2015. The current usage metrics is available 48-96 hours after online publication and is updated daily on week days.
Initial download of the metrics may take a while.