Open Access
Fig. 21
Download original image
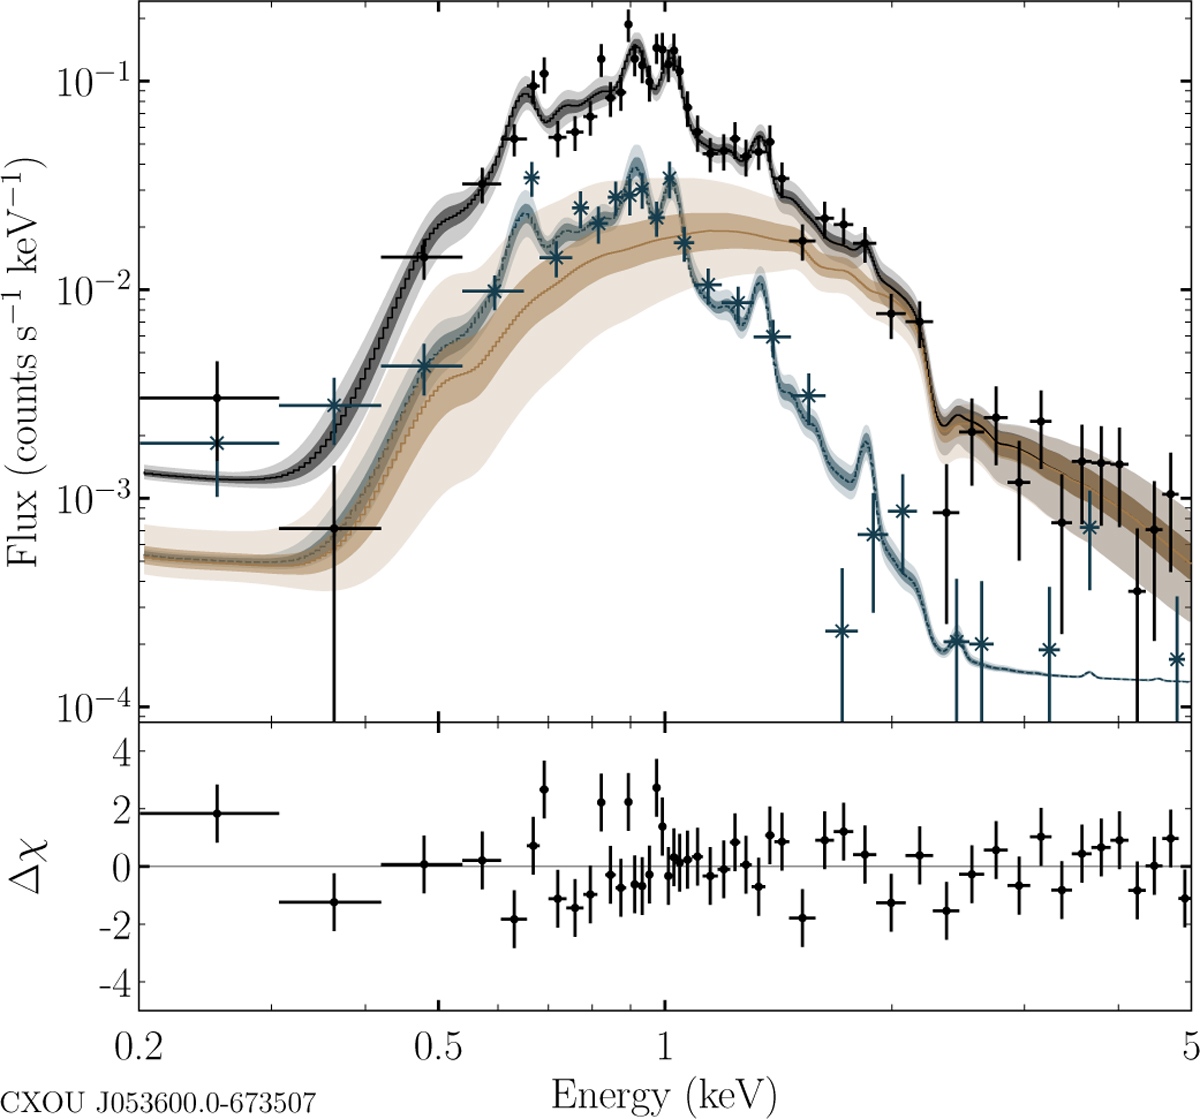
eROSITA spectra of the Gamma-ray binary CXOU J053600.0−673507 merged over all eRASS like Fig. 17. The dark yellow curve shows the best-fit model for the source (absorbed power law). The blue curve and shaded area show the best fit for a sum of particle background and a
vapecmodel for the SNR contribution in the on-region. The background spectrum is dominated by the SNR emission up to ∼2 keV, where the particle background takes over. The black curve and shaded area are the sum of the source and background models.
Current usage metrics show cumulative count of Article Views (full-text article views including HTML views, PDF and ePub downloads, according to the available data) and Abstracts Views on Vision4Press platform.
Data correspond to usage on the plateform after 2015. The current usage metrics is available 48-96 hours after online publication and is updated daily on week days.
Initial download of the metrics may take a while.