Fig. A.2
Download original image
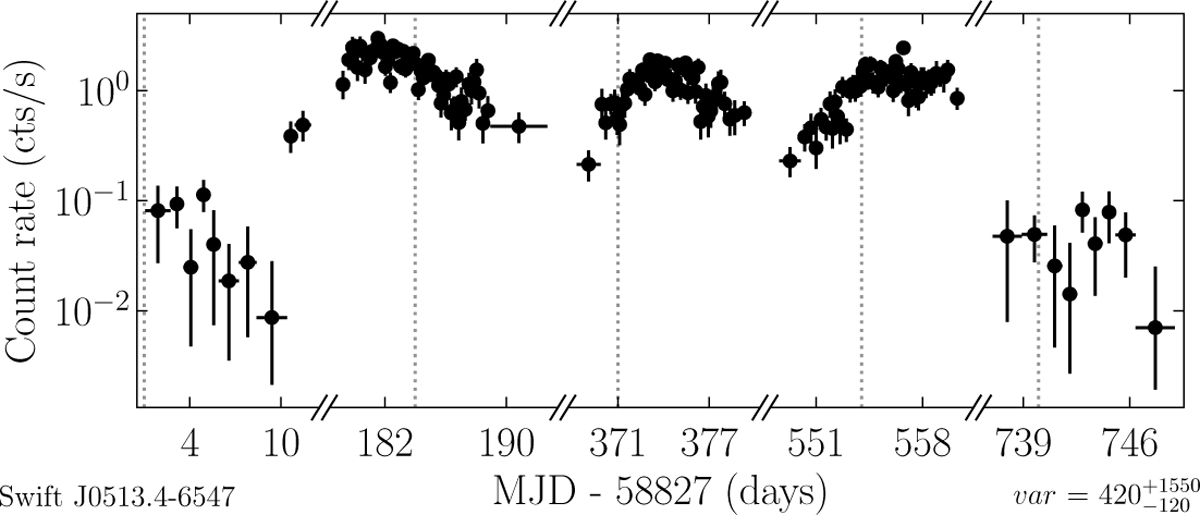
Example for Fig. A.2 in Kaltenbrunner (2025). eROSITA light curve for #9. For readability white spaces between the individual eRASSs are removed. The light curves are rebinned to have a minimum number of 10 net source counts per time bin as described in Sect. 4.2.1. The variability var (found in the bottom right of each figure) is calculated as described in Sect 4.2.2.
Current usage metrics show cumulative count of Article Views (full-text article views including HTML views, PDF and ePub downloads, according to the available data) and Abstracts Views on Vision4Press platform.
Data correspond to usage on the plateform after 2015. The current usage metrics is available 48-96 hours after online publication and is updated daily on week days.
Initial download of the metrics may take a while.