Fig. 3
Download original image
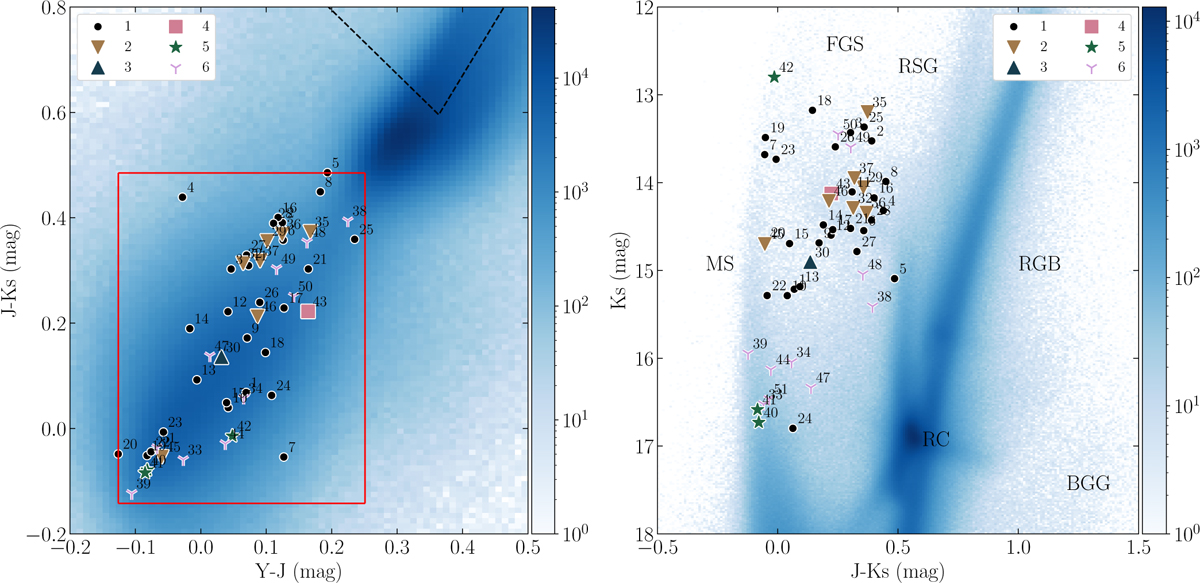
Left: distribution of VMC counterparts of all sources in our catalogue grouped by confidence class (see Table 7) in the VMC colour-colour plane compared to the typical location of QSOs marked by the dotted line (see Cioni et al. 2013, Eq. (1)–(3)) and the distribution of LMC stars (colour mesh; found by matching VMC with Gaia proper motion selection). The colour scale gives the number of sources in each colour-colour bin. The bin sizes are 0.01 mag for both axes. Right: sources in our catalogue in the colour-magnitude plane compared to different stellar evolution stages and features caused by foreground and background objects (see Sun et al. 2017, their Fig. 2 and Sect. 3.1; MS: main-sequence, RGB: red giant branch, RC: red clump, RSG: red supergiants, FGS: foreground Galactic stars, BGG: background galaxies) and LMC stars (colour mesh). The colour scale gives the number of sources in each colour-magnitude bin. The bin sizes are 0.01 and 0.02 mag for Y−J and Ks, respectively.
Current usage metrics show cumulative count of Article Views (full-text article views including HTML views, PDF and ePub downloads, according to the available data) and Abstracts Views on Vision4Press platform.
Data correspond to usage on the plateform after 2015. The current usage metrics is available 48-96 hours after online publication and is updated daily on week days.
Initial download of the metrics may take a while.