Fig. 5
Download original image
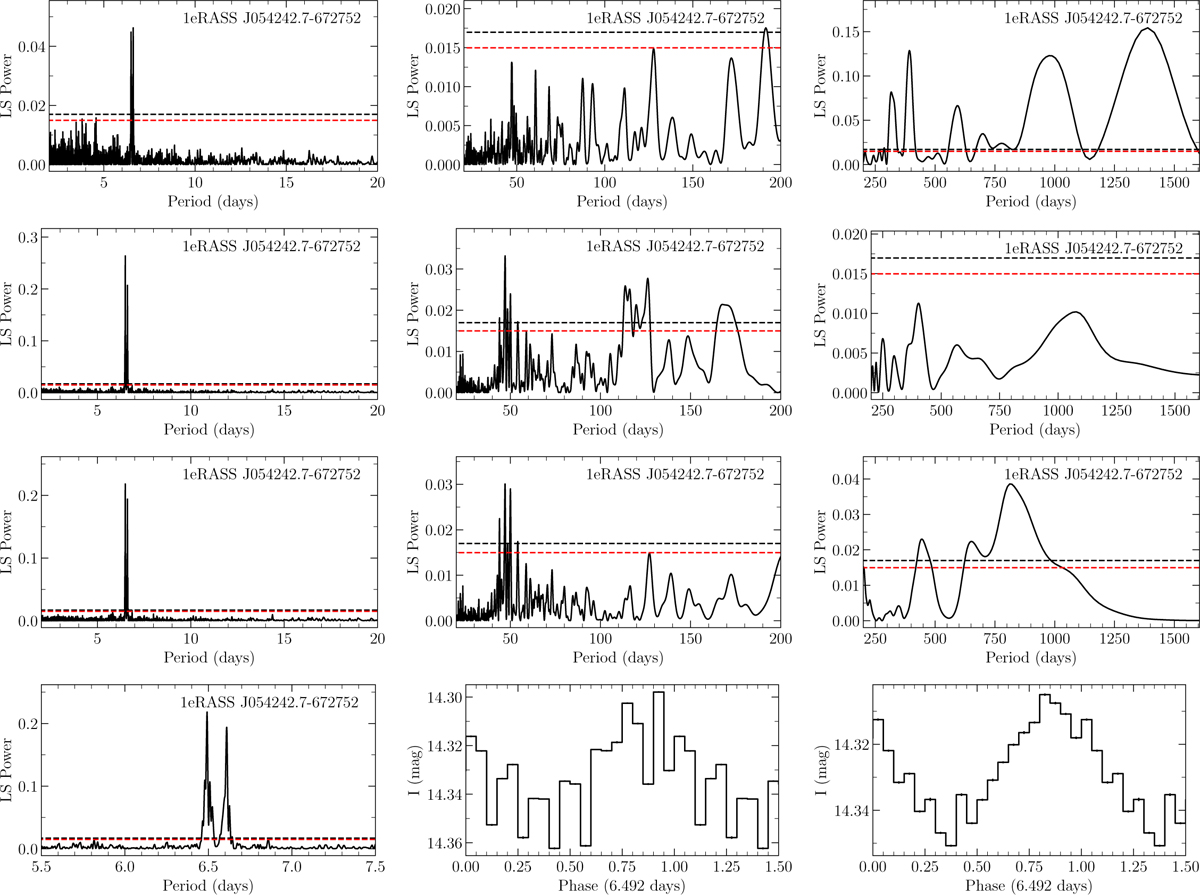
LS analysis of the OGLE I-band light curve of 1eRASS J054242.7−672752 (see source 46 in Table 5 and Fig. D.2). The top three rows show the LS periodogram split into three period ranges (for better visualisation): 2−20 d, 20−200 d, and 200 d to ∼1600 d, which is one-third of the monitoring period. The first row pertains to the original, the second row to the spline fit, and the third to the Savitzky–Golay filtered light curves (window 101). The bottom row shows a zoom of the LS periodogram and the light curves folded with the period with the highest power at 6.49 d (middle panel for original and right panel for spline-detrended light curves). The dashed red and black lines mark the 95 and 99% confidence levels.
Current usage metrics show cumulative count of Article Views (full-text article views including HTML views, PDF and ePub downloads, according to the available data) and Abstracts Views on Vision4Press platform.
Data correspond to usage on the plateform after 2015. The current usage metrics is available 48-96 hours after online publication and is updated daily on week days.
Initial download of the metrics may take a while.