Fig. 1
Download original image
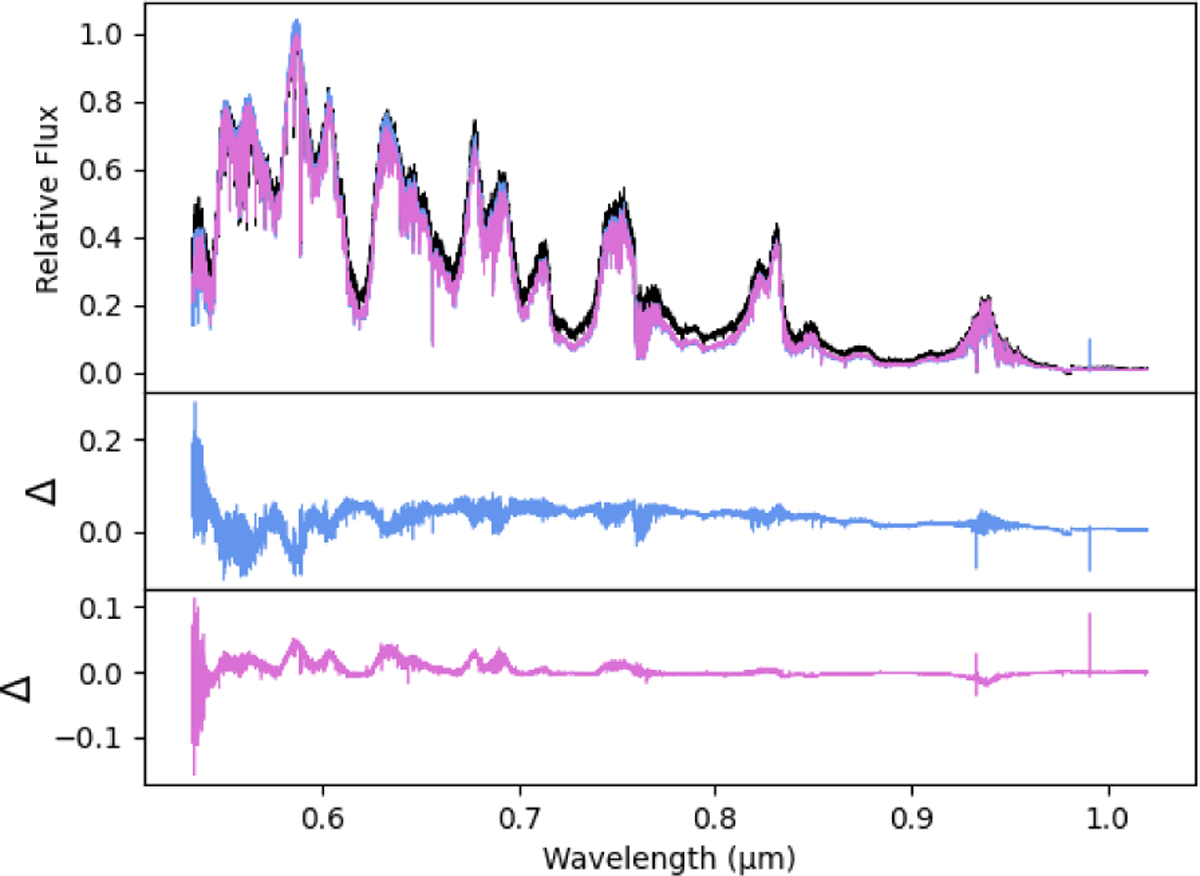
Full spatial summation reduction. Top panel: comparison of Neptune’s visible spectrum before (black), after adjusting for wavelength-dependent centroid shifts (blue), and after the complete targeted spatial extraction (pink). Bottom panels: residuals (Δ). The blue residual shows the difference between the original spectrum and after the centroid shifts (original - centroid shifted). The pink residuals are the difference between the centroid-shifted spectrum and the final version, thus highlighting the stepwise changes (Centroid shifted-final S/N optimized).
Current usage metrics show cumulative count of Article Views (full-text article views including HTML views, PDF and ePub downloads, according to the available data) and Abstracts Views on Vision4Press platform.
Data correspond to usage on the plateform after 2015. The current usage metrics is available 48-96 hours after online publication and is updated daily on week days.
Initial download of the metrics may take a while.