Open Access
Fig. A.9
Download original image
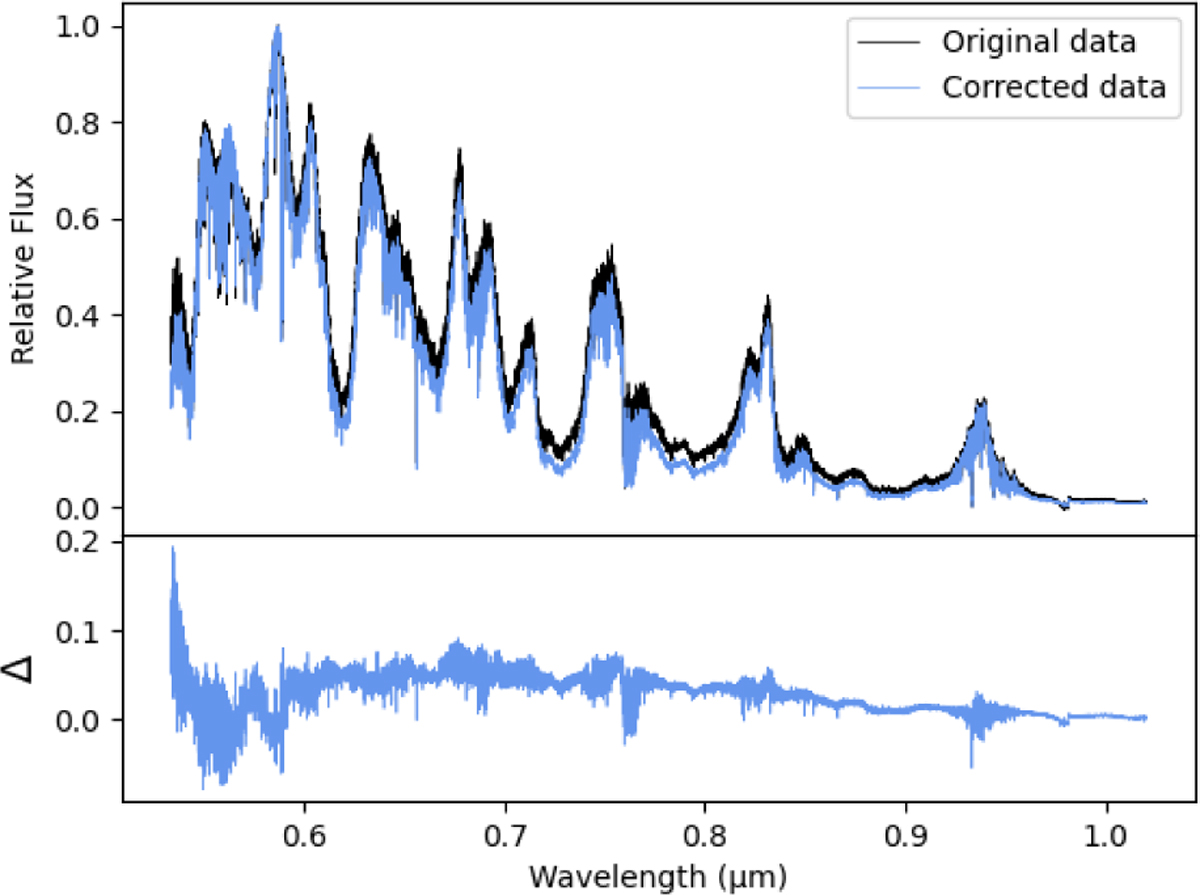
Neptune’s spectrum before (black) and after (blue) the full spatial integration (top). The rescaled blue spectrum represents the summed flux from all pixels within the spatial integration region, providing a more complete spectral signature of the planet. The residuals between the two are shown on bottom.
Current usage metrics show cumulative count of Article Views (full-text article views including HTML views, PDF and ePub downloads, according to the available data) and Abstracts Views on Vision4Press platform.
Data correspond to usage on the plateform after 2015. The current usage metrics is available 48-96 hours after online publication and is updated daily on week days.
Initial download of the metrics may take a while.