Open Access
Fig. A.13
Download original image
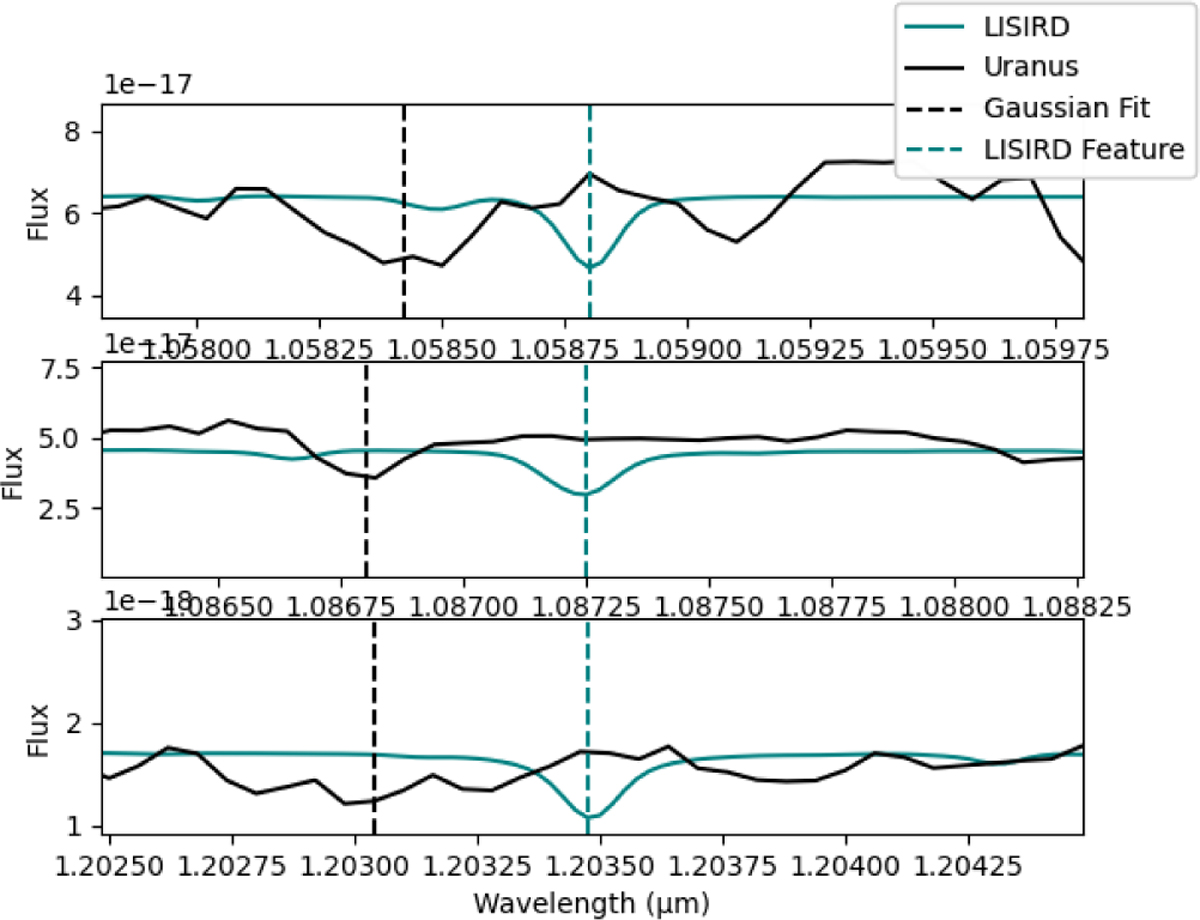
LISIRD feature comparison with Uranus data. A detailed comparison of a solar absorption feature in the LISIRD spectrum (teal) and the same feature in Uranus’s spectrum (black). The dashed lines mark the feature centers identified by Gaussian fitting for realignment.
Current usage metrics show cumulative count of Article Views (full-text article views including HTML views, PDF and ePub downloads, according to the available data) and Abstracts Views on Vision4Press platform.
Data correspond to usage on the plateform after 2015. The current usage metrics is available 48-96 hours after online publication and is updated daily on week days.
Initial download of the metrics may take a while.