Open Access
Fig. 4
Download original image
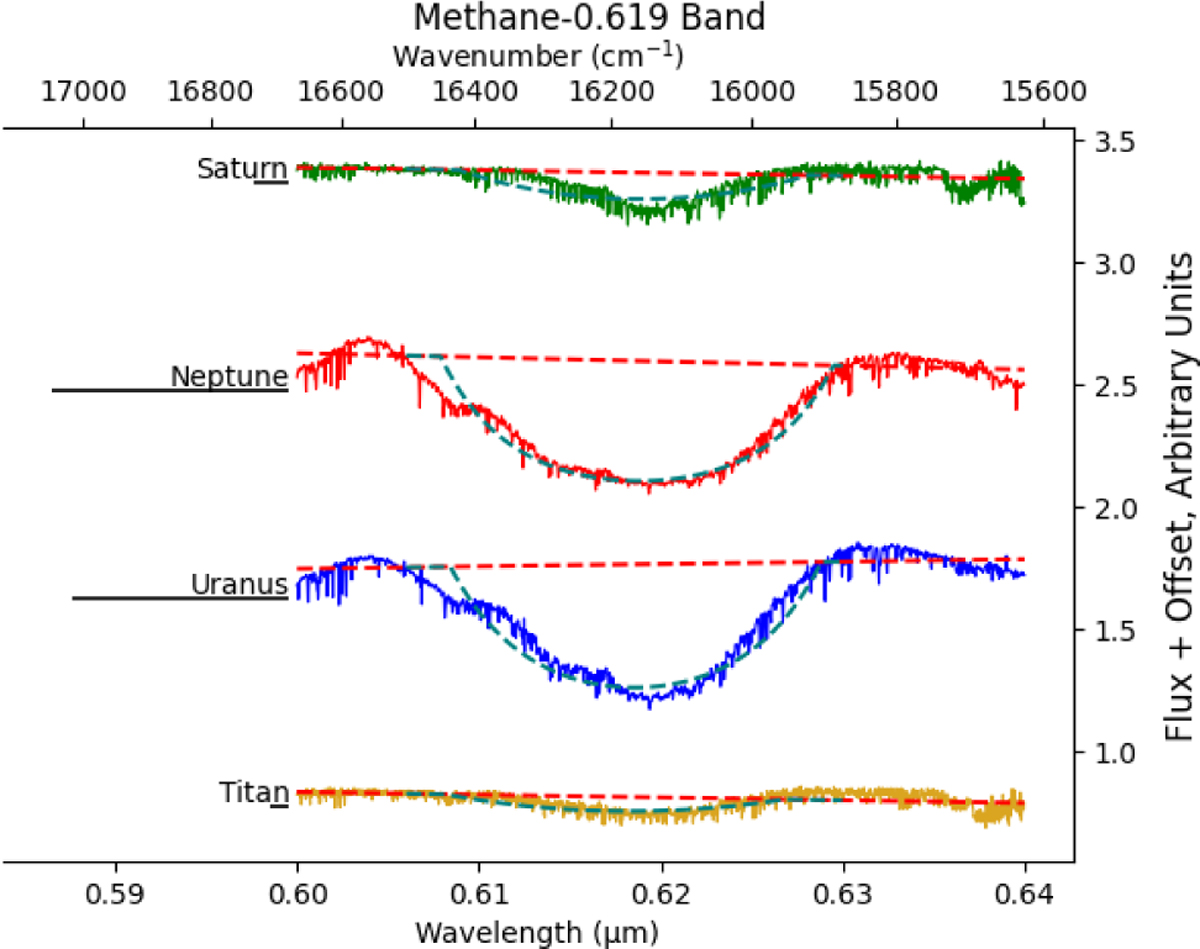
>Methane 0.619 band. The dashed red lines represent the baseline for comparison, while teal lines indicate a Gaussian fit of the absorption feature for visual aid. The black line under the object name on the left shows the calculated EW.
Current usage metrics show cumulative count of Article Views (full-text article views including HTML views, PDF and ePub downloads, according to the available data) and Abstracts Views on Vision4Press platform.
Data correspond to usage on the plateform after 2015. The current usage metrics is available 48-96 hours after online publication and is updated daily on week days.
Initial download of the metrics may take a while.