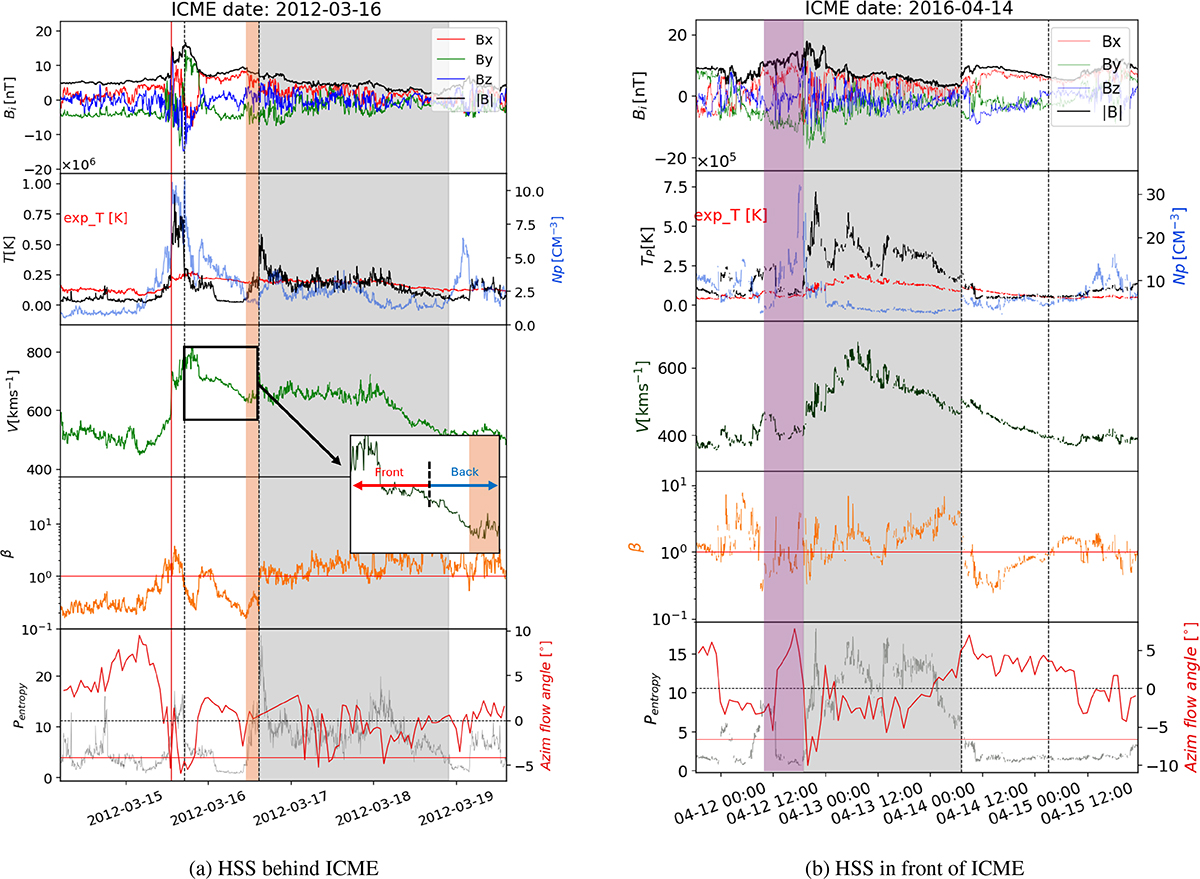
Fig. 1.
Download original image
Plots showing examples of ICME-HSS interaction and HSS-ICME interaction. Top panel: Magnetic field components in GSE coordinates. Second panel: Proton temperature (black) over plotted with the expected plasma temperature (red) and plasma density (blue). Third panel: Plasma velocity. Fourth panel: Plasma beta. Fifth panel: Plasma entropy (grey) and azimuthal (longitudinal) plasma flow angle (red). The horizontal red line in panel four marks the value one for plasma beta, the horizontal red line in panel four marks the value four for plasma entropy, while the horizontal black line marks zero for azimuthal flow angle. The shaded grey regions show the HSS (from the stream interface to the end), whereas the vertical black lines mark the start and end of the MO. The shaded brown region in the left panels marks the disturbed region (the zoomed-in plot highlights the same with the front and back of the MO marked with red and blue arrows, respectively. For more details, see the main text). The shaded purple region in the right panels marks the compression region + SIR.
Current usage metrics show cumulative count of Article Views (full-text article views including HTML views, PDF and ePub downloads, according to the available data) and Abstracts Views on Vision4Press platform.
Data correspond to usage on the plateform after 2015. The current usage metrics is available 48-96 hours after online publication and is updated daily on week days.
Initial download of the metrics may take a while.