Open Access
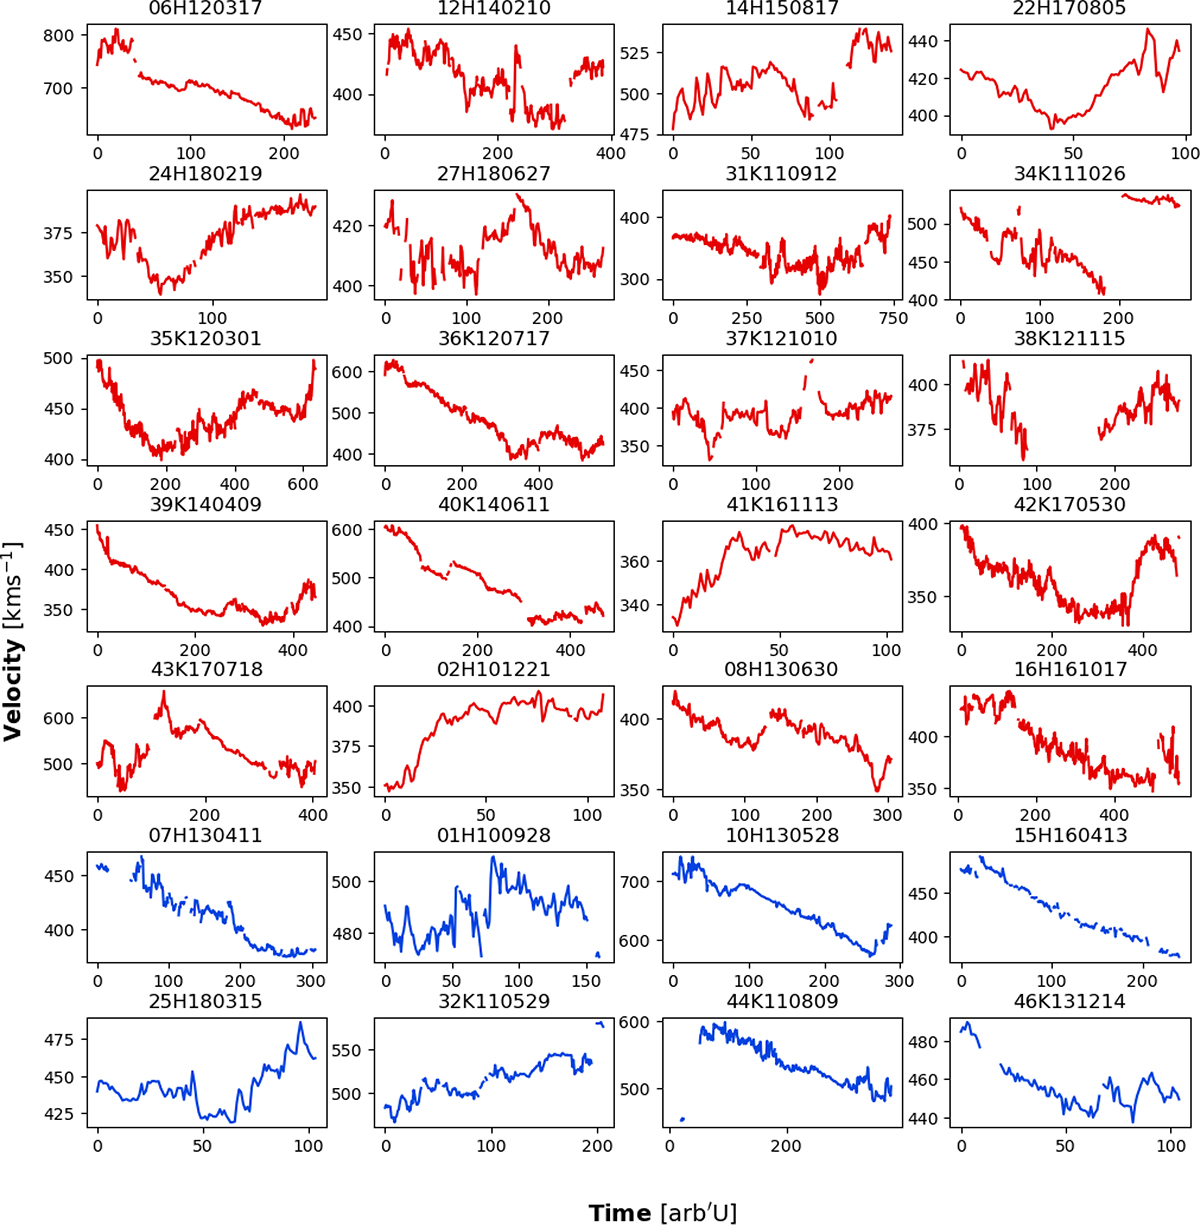
Fig. A.1.
Download original image
Velocity profiles inside MO. Plots in red show the cases where the HSS is behind the ICME, and plots in blue show the cases where the HSS is in front of the ICME.
Current usage metrics show cumulative count of Article Views (full-text article views including HTML views, PDF and ePub downloads, according to the available data) and Abstracts Views on Vision4Press platform.
Data correspond to usage on the plateform after 2015. The current usage metrics is available 48-96 hours after online publication and is updated daily on week days.
Initial download of the metrics may take a while.