Fig. 14
Download original image
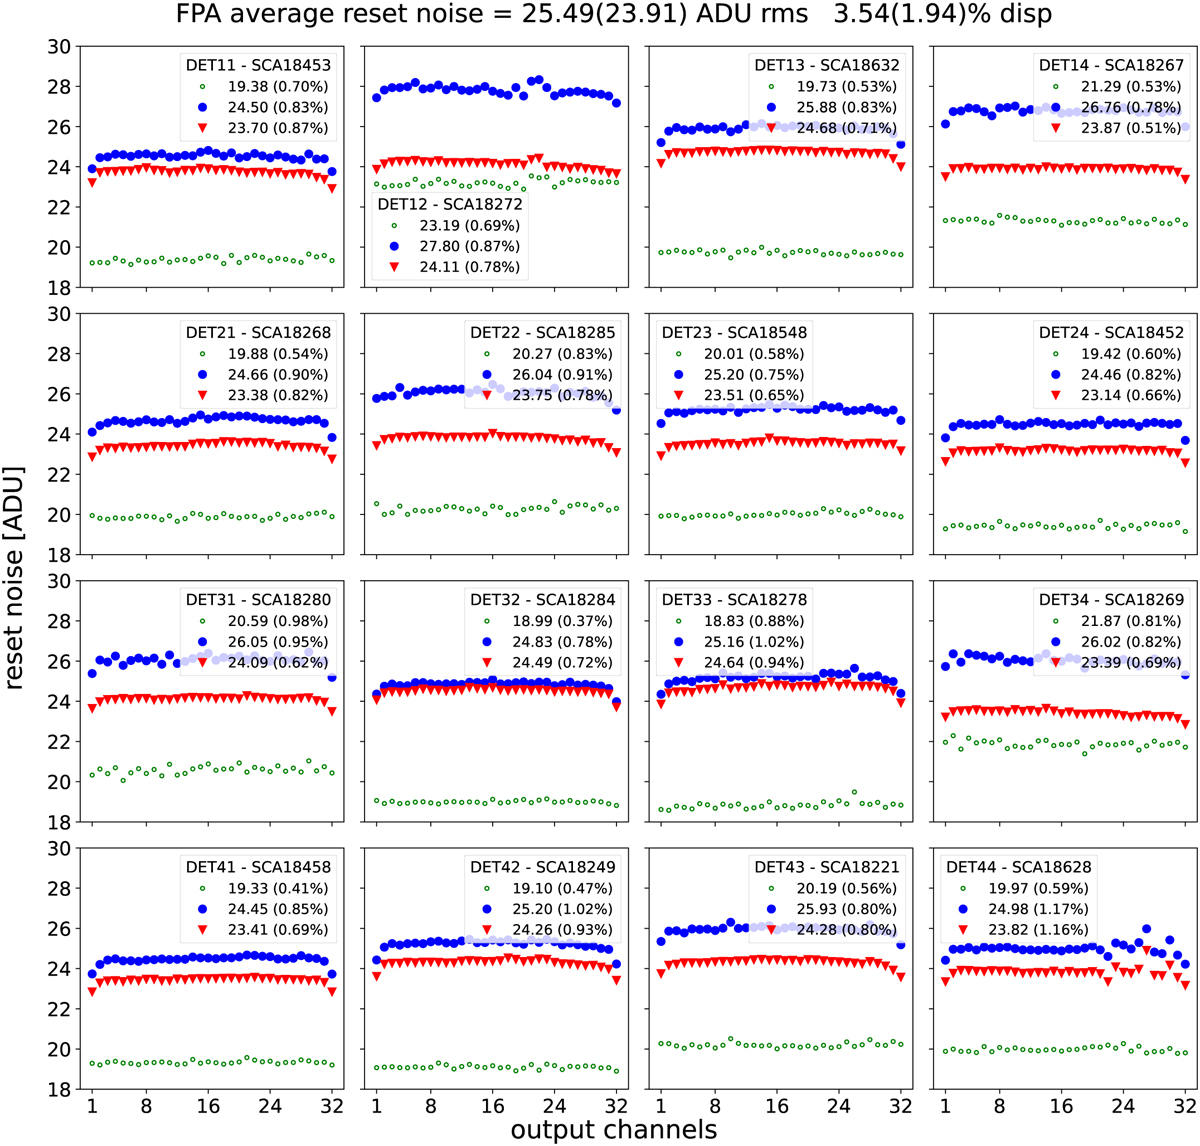
Reset noise of science pixels before (blue circles) and after (red triangles) reference pixel correction. The reset noise of reference pixels is shown as green circles. For each detector in the legend the average reset noise over the 32 channels is indicated, and in parentheses the relative dispersion of the average reset noise between channels is given. At the top (in the title) we indicate the average reset noise over the whole FPA and the dispersion between detectors before reference pixel correction. The values after reference pixel correction are given in brackets.
Current usage metrics show cumulative count of Article Views (full-text article views including HTML views, PDF and ePub downloads, according to the available data) and Abstracts Views on Vision4Press platform.
Data correspond to usage on the plateform after 2015. The current usage metrics is available 48-96 hours after online publication and is updated daily on week days.
Initial download of the metrics may take a while.