Fig. 18
Download original image
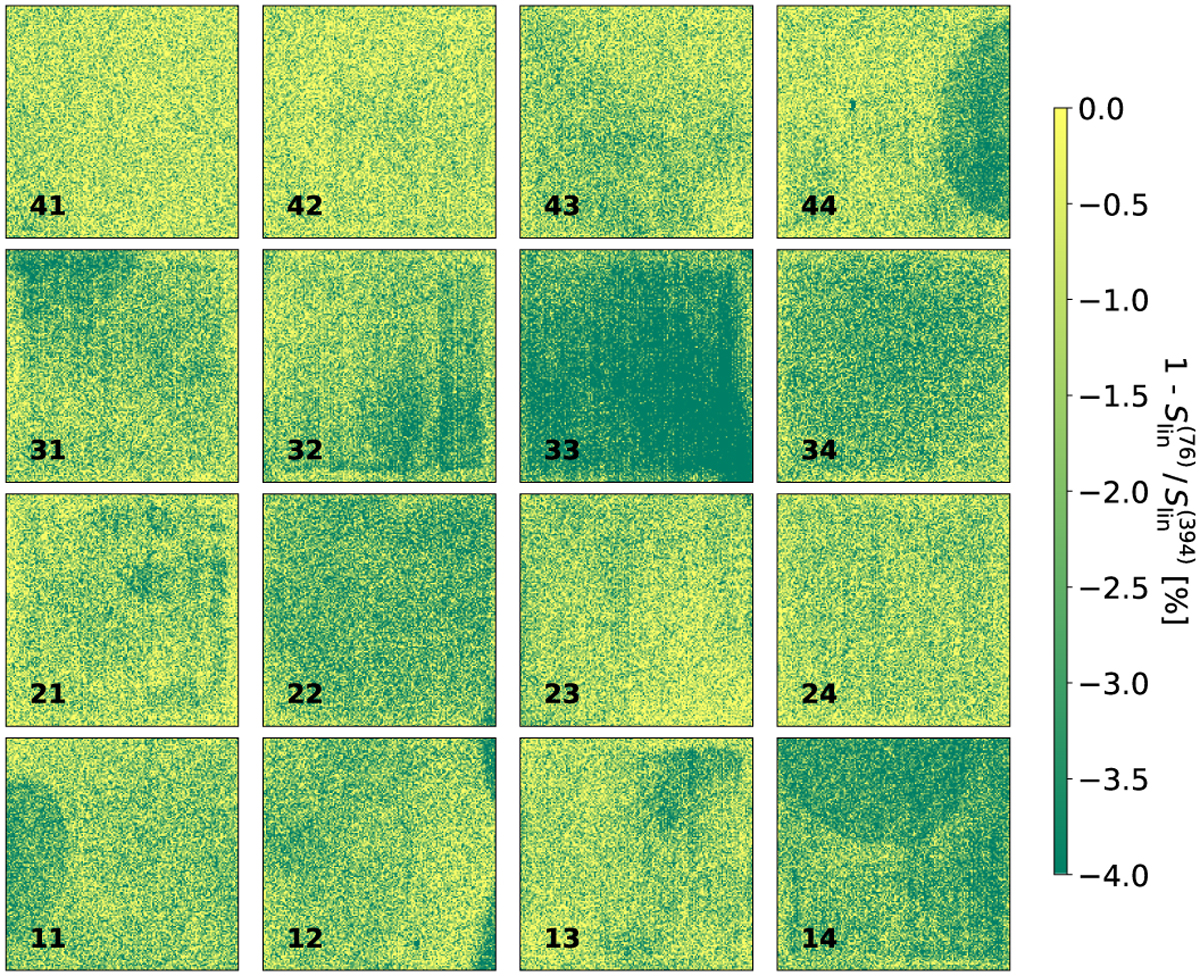
Difference between the linear coefficient of the polynomial to the first 76 frames of the ramp with respect to the linear coefficient of the polynomial to all the 396 frames that were acquired. A correlation with the persistence map (Fig. 19) is evident. The difference in the linear flux estimate for pixels with high persistence can reach 4%.
Current usage metrics show cumulative count of Article Views (full-text article views including HTML views, PDF and ePub downloads, according to the available data) and Abstracts Views on Vision4Press platform.
Data correspond to usage on the plateform after 2015. The current usage metrics is available 48-96 hours after online publication and is updated daily on week days.
Initial download of the metrics may take a while.