Open Access
Fig. 1.
Download original image
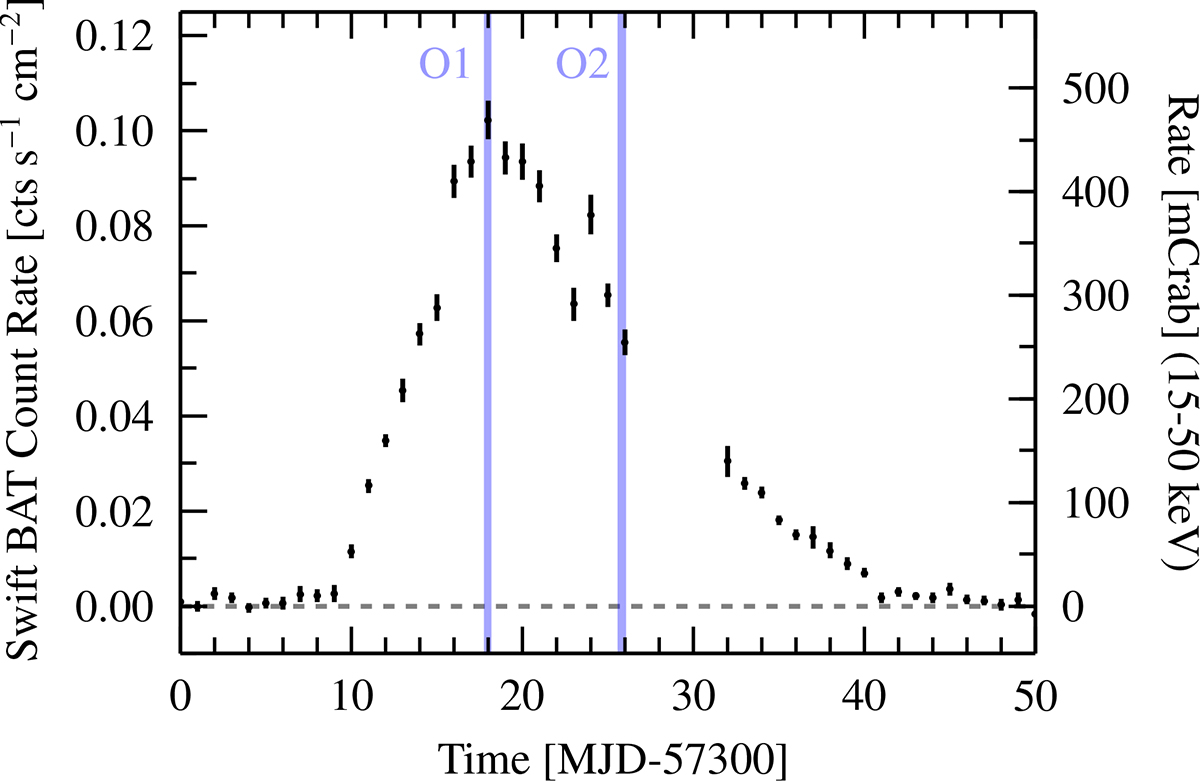
Swift Burst Alert Telescope (BAT; Barthelmy et al. 2005) light curve of the 2015 outburst of 4U 0115+63 in the 15–50 keV band with a binning of 1 d. The blue-shaded regions highlight the quasi-simultaneous NuSTAR and Swift observation times.
Current usage metrics show cumulative count of Article Views (full-text article views including HTML views, PDF and ePub downloads, according to the available data) and Abstracts Views on Vision4Press platform.
Data correspond to usage on the plateform after 2015. The current usage metrics is available 48-96 hours after online publication and is updated daily on week days.
Initial download of the metrics may take a while.