Fig. A.1.
Download original image
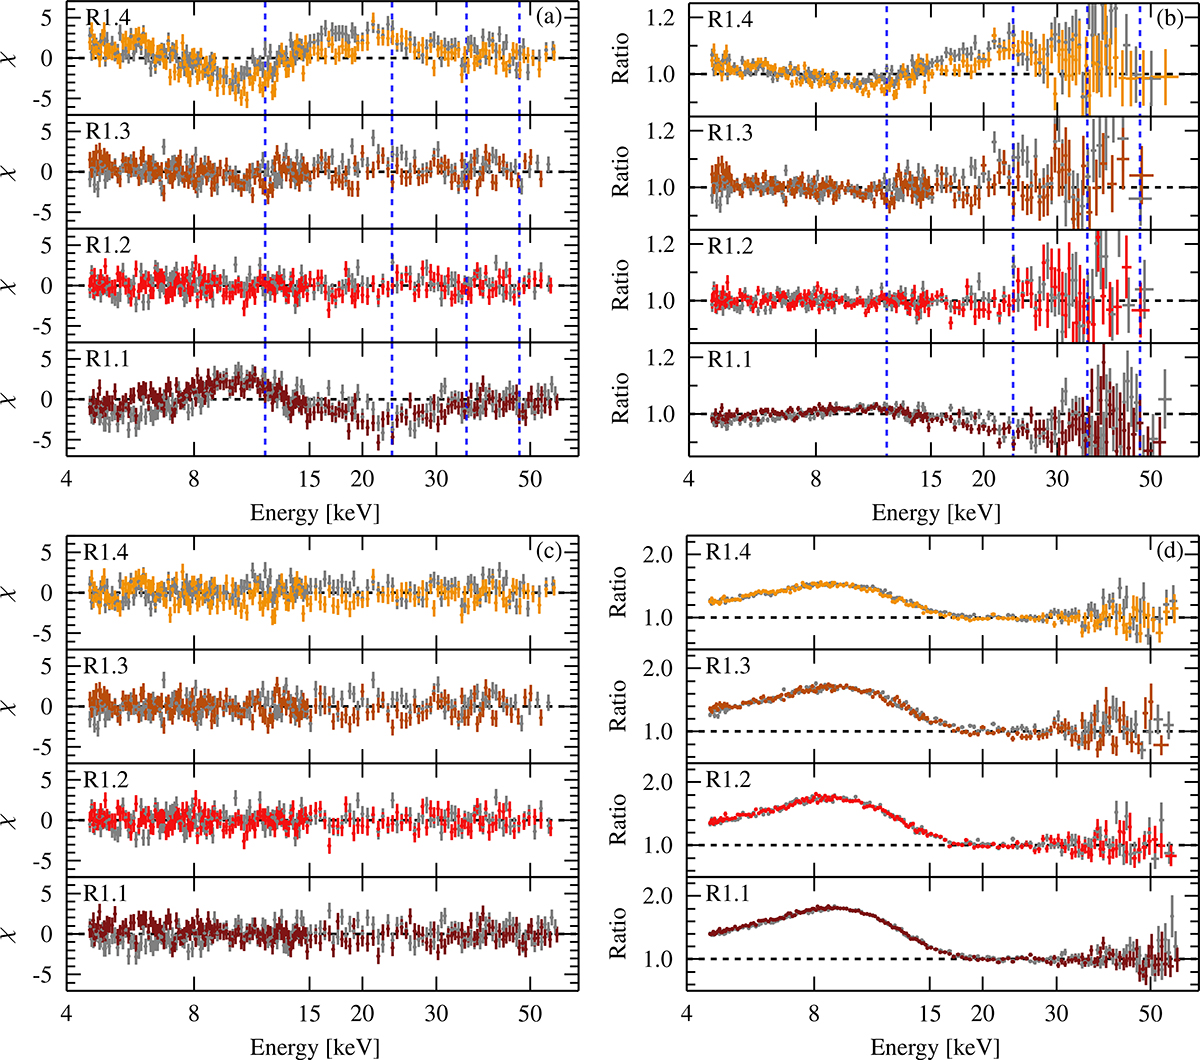
Residuals of the flux-resolved spectra of N1 (FPMA in gray, FPMB in varying color). The blue dashed lines in panels (a) and (b) mark the positions of the CRSFs, using the values listed in Table B.1. The χ2 residuals (a) and ratio (b), when only evaluating and re-normalizing the flux-averaged best-fit parameters, are shown. Refitting the parameters of the four flux-resolved spectra simultaneously, lead to the best fit as given in panel (c). Panel (d) highlights the contribution of the “10 keV feature”, by showing the resulting ratio after removing the component from the best-fit that is shown in the lower left panel.
Current usage metrics show cumulative count of Article Views (full-text article views including HTML views, PDF and ePub downloads, according to the available data) and Abstracts Views on Vision4Press platform.
Data correspond to usage on the plateform after 2015. The current usage metrics is available 48-96 hours after online publication and is updated daily on week days.
Initial download of the metrics may take a while.