Open Access
Fig. 2.
Download original image
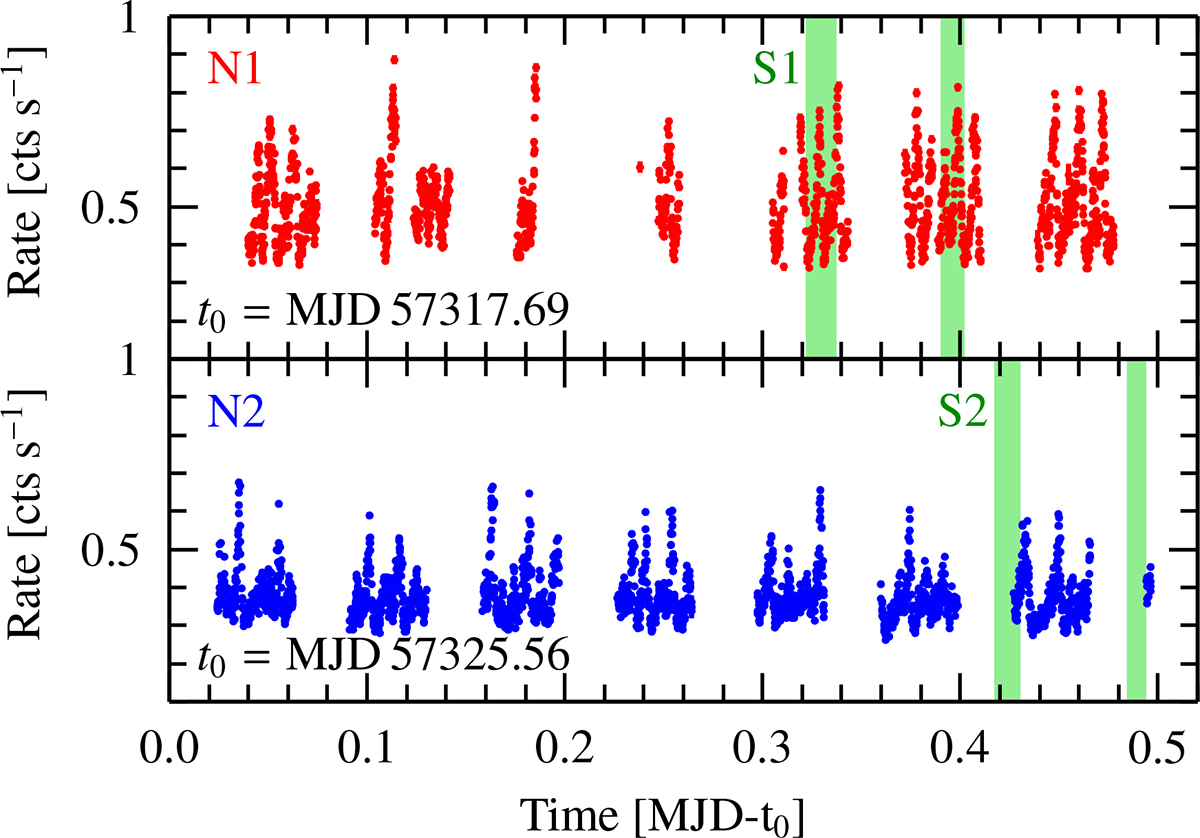
N1 (top) and N2 (bottom) light curves, using combined data from FPMA and FPMB for clarity binned at three times the spin period of 4U 0115+63. The green-shaded regions highlight the observation periods of the S1 and S2 Swift snapshots.
Current usage metrics show cumulative count of Article Views (full-text article views including HTML views, PDF and ePub downloads, according to the available data) and Abstracts Views on Vision4Press platform.
Data correspond to usage on the plateform after 2015. The current usage metrics is available 48-96 hours after online publication and is updated daily on week days.
Initial download of the metrics may take a while.