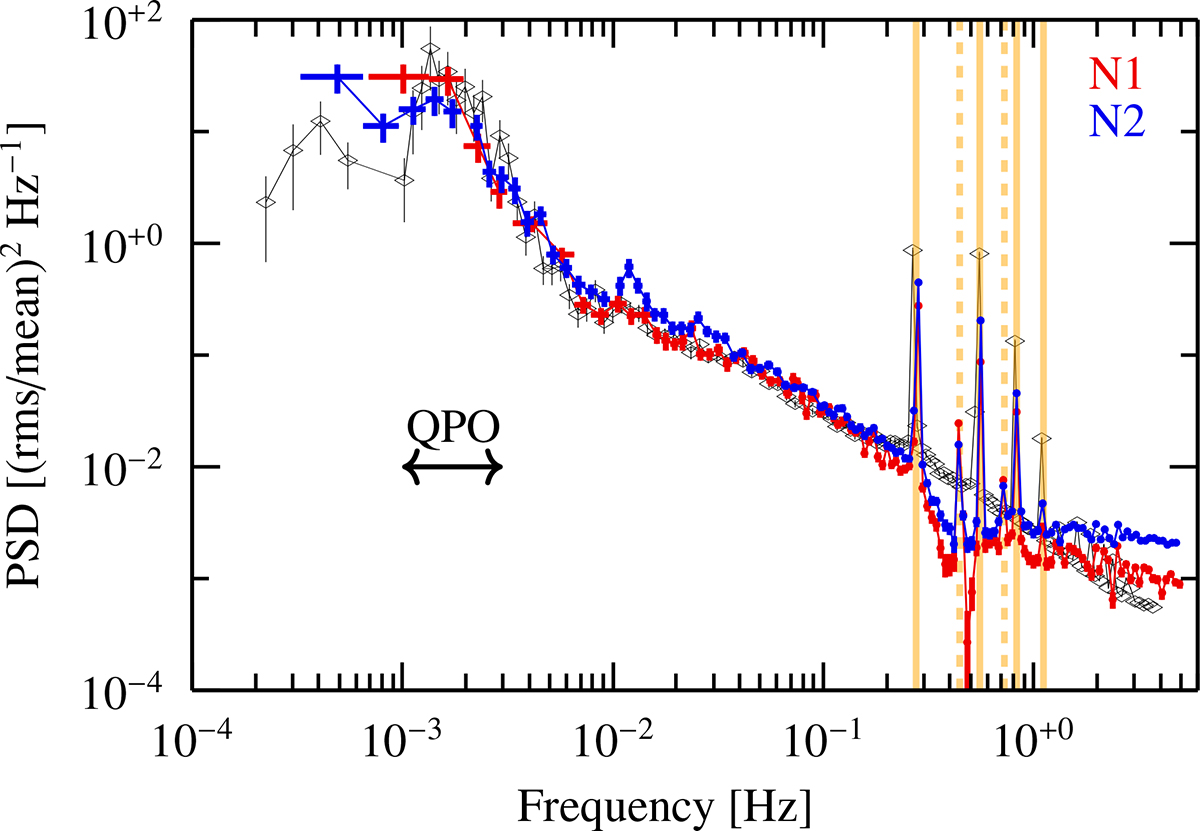
Fig. 4.
Download original image
PSDs of the NuSTAR observations, shown in red for N1 and blue for N2. For comparison the black data points indicate the results obtained by Heindl et al. (1999). The vertical solid orange lines highlight the spin frequency of the NS and its higher harmonics. The vertical dashed lines mark two additional peaks at 1.6 and 2.6 times the NS spin frequency.
Current usage metrics show cumulative count of Article Views (full-text article views including HTML views, PDF and ePub downloads, according to the available data) and Abstracts Views on Vision4Press platform.
Data correspond to usage on the plateform after 2015. The current usage metrics is available 48-96 hours after online publication and is updated daily on week days.
Initial download of the metrics may take a while.