Fig. 7.
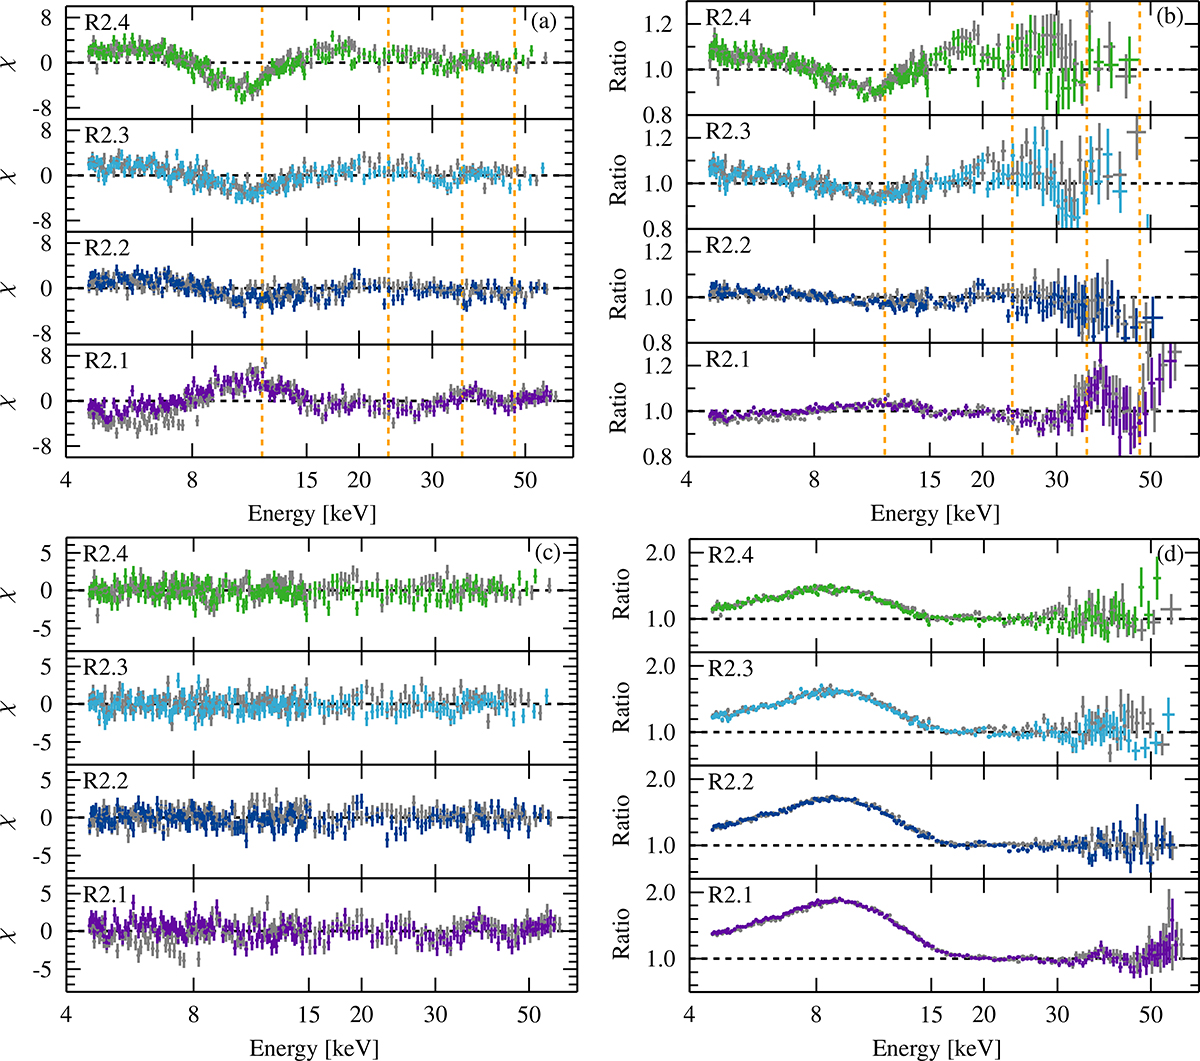
Download original image
Residuals of the N2 flux-resolved spectra (FPMA in gray; FPMB in varying colors). The dashed orange lines mark the CRSF positions, using the values listed in Table B.1. Renormalizing the spectral model to the source flux without changing spectral parameters results in the χ2 residuals (a) and ratio (b). Refitting the parameters of the four flux-resolved spectra simultaneously leads to the best fit (c). (d): Contribution of the “10 keV feature”, showing the resulting ratio after removing the component from the best-fit.
Current usage metrics show cumulative count of Article Views (full-text article views including HTML views, PDF and ePub downloads, according to the available data) and Abstracts Views on Vision4Press platform.
Data correspond to usage on the plateform after 2015. The current usage metrics is available 48-96 hours after online publication and is updated daily on week days.
Initial download of the metrics may take a while.