Open Access
Fig. 8.
Download original image
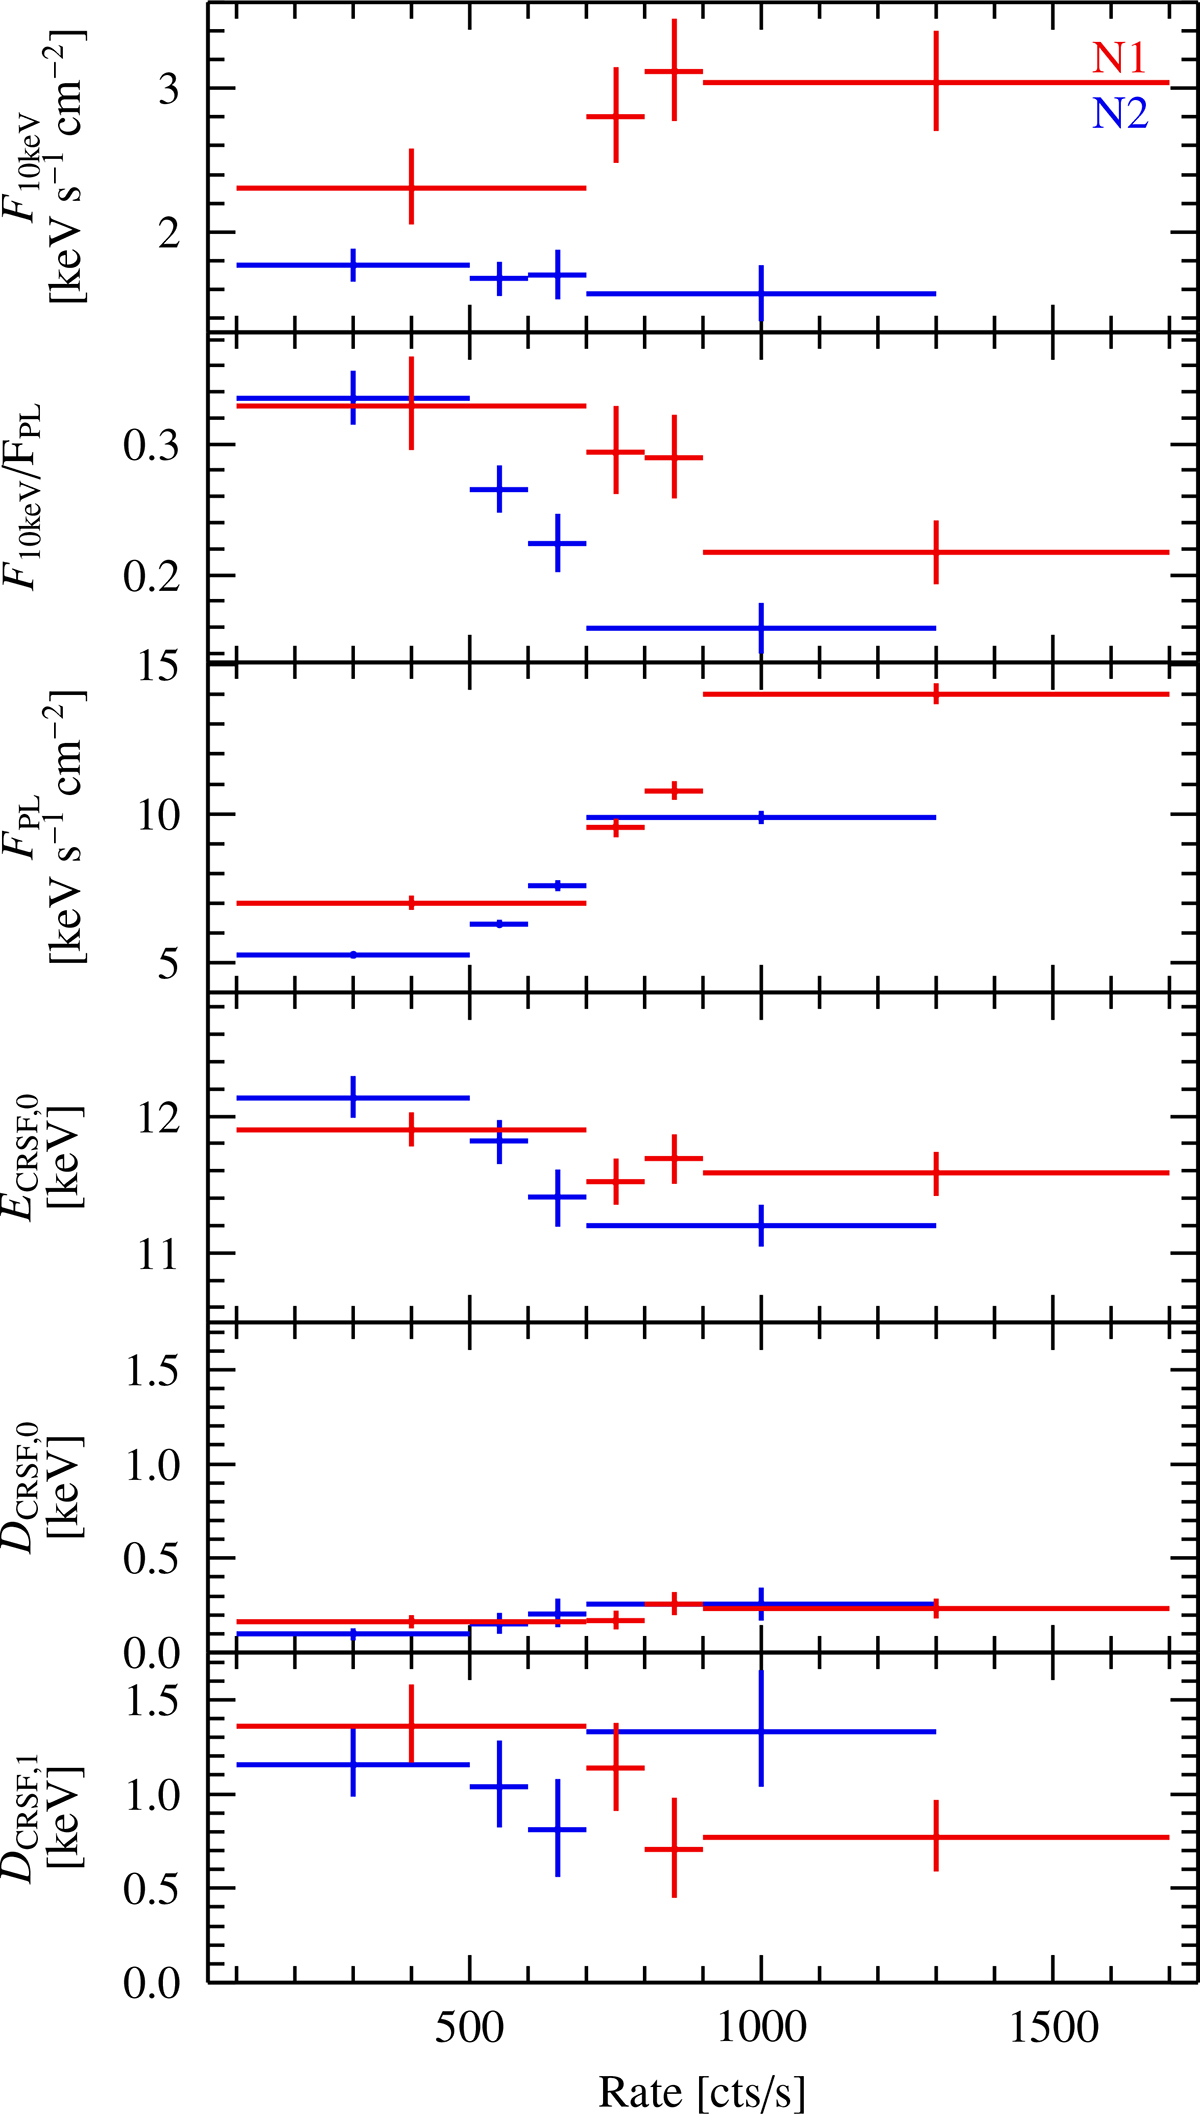
Selected best-fit parameters of the flux-resolved spectra of N1 (red) and N2 (blue), as given in Table B.2. The horizontal bars indicate the band for the rate selection (using the full NuSTAR energy range). The vertical error bars show the 90% confidence interval for the values shown.
Current usage metrics show cumulative count of Article Views (full-text article views including HTML views, PDF and ePub downloads, according to the available data) and Abstracts Views on Vision4Press platform.
Data correspond to usage on the plateform after 2015. The current usage metrics is available 48-96 hours after online publication and is updated daily on week days.
Initial download of the metrics may take a while.