Fig. 9.
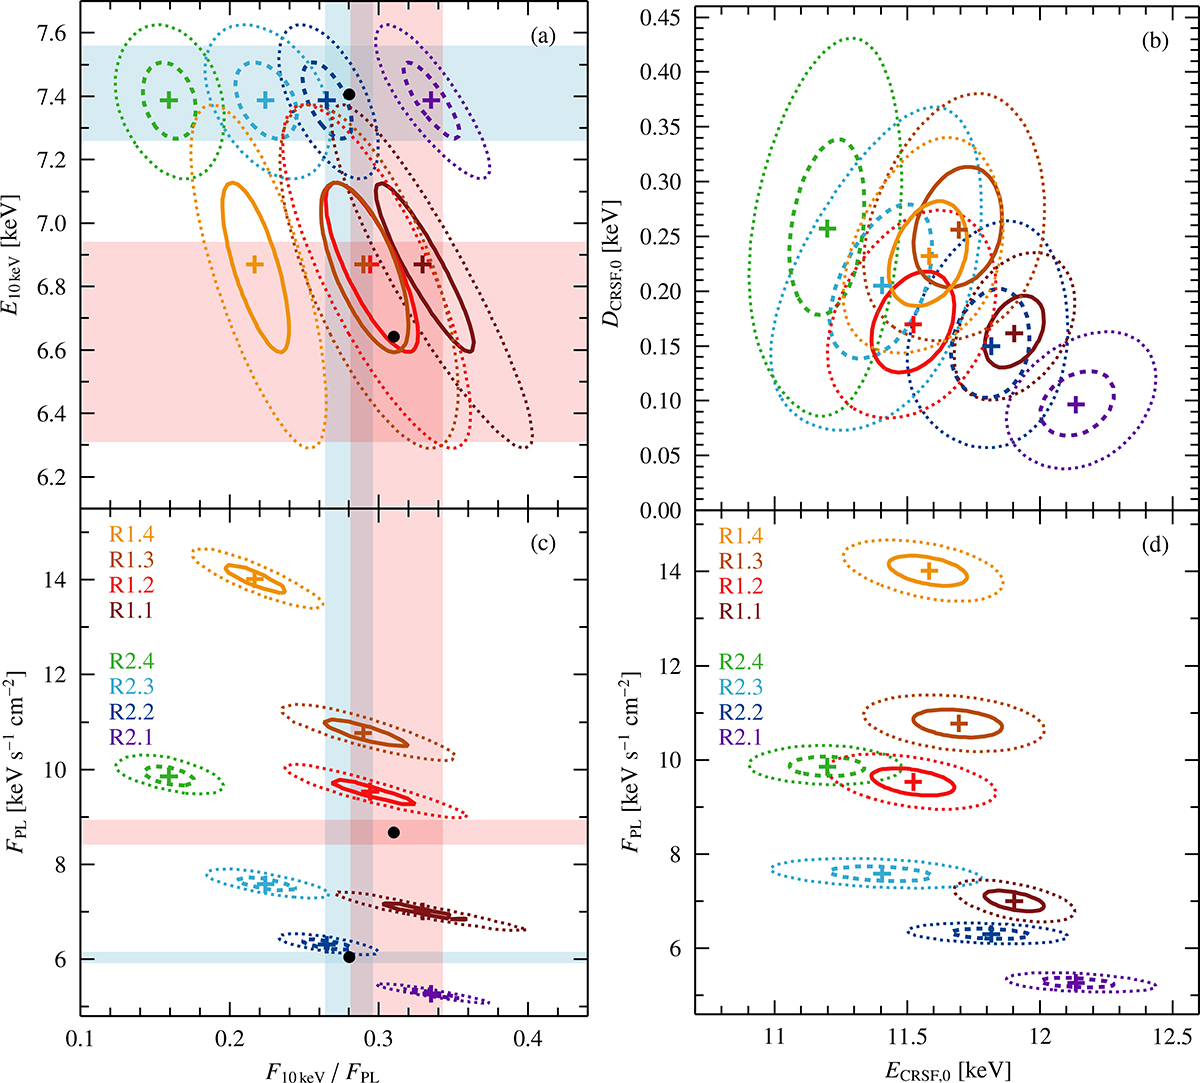
Download original image
Confidence contours of ratios between fundamental CRSF parameters, “10 keV feature”, and continuum flux correlations. For all flux-resolved spectra, the best-fit values are marked with a cross. The dotted lines show the 3σ contours, and the solid lines indicate the 1σ contours for the N1 (red) and N2 (blue) observations, respectively. The black points mark the best-fit values from the flux-averaged dataset, while the shaded regions in the left panels (N1 in red and N2 in blue) highlight the uncertainties of the averaged best fit, as given in Table B.1.
Current usage metrics show cumulative count of Article Views (full-text article views including HTML views, PDF and ePub downloads, according to the available data) and Abstracts Views on Vision4Press platform.
Data correspond to usage on the plateform after 2015. The current usage metrics is available 48-96 hours after online publication and is updated daily on week days.
Initial download of the metrics may take a while.